After Gold Breaches $3,600, How High Can Prices Climb?
![]() FoolBull
FoolBull
23:37 September 8, 2025 EDT
Key Points:
Starting from around $2,600 at the beginning of the year, gold has steadily climbed, gaining $1,000 in less than nine months, with a year-to-date increase of more than 38%.
From a technical perspective, gold exhibits a classic strong bullish pattern, but the market is now in overbought territory, suggesting a potential consolidation phase before the next leg higher.
If the Federal Reserve delivers a more dovish signal at its September policy meeting, it could further open the upside for gold. Conversely, if the Fed emphasizes inflation risks and hints at limited scope for rate cuts, a price pullback could follow.
On September 8, 2025, the gold market reached another historic milestone—COMEX gold futures surged intraday to $3,655.5 per ounce, while spot gold in London climbed to $3,646.29 per ounce, breaking above the $3,600 psychological threshold for the first time. As of the Asian session on September 9, spot gold was trading near $3,645 per ounce, extending an 8% rally over the past 11 sessions and sustaining the strong uptrend that began in November 2022, during which prices have advanced by a cumulative 84%.
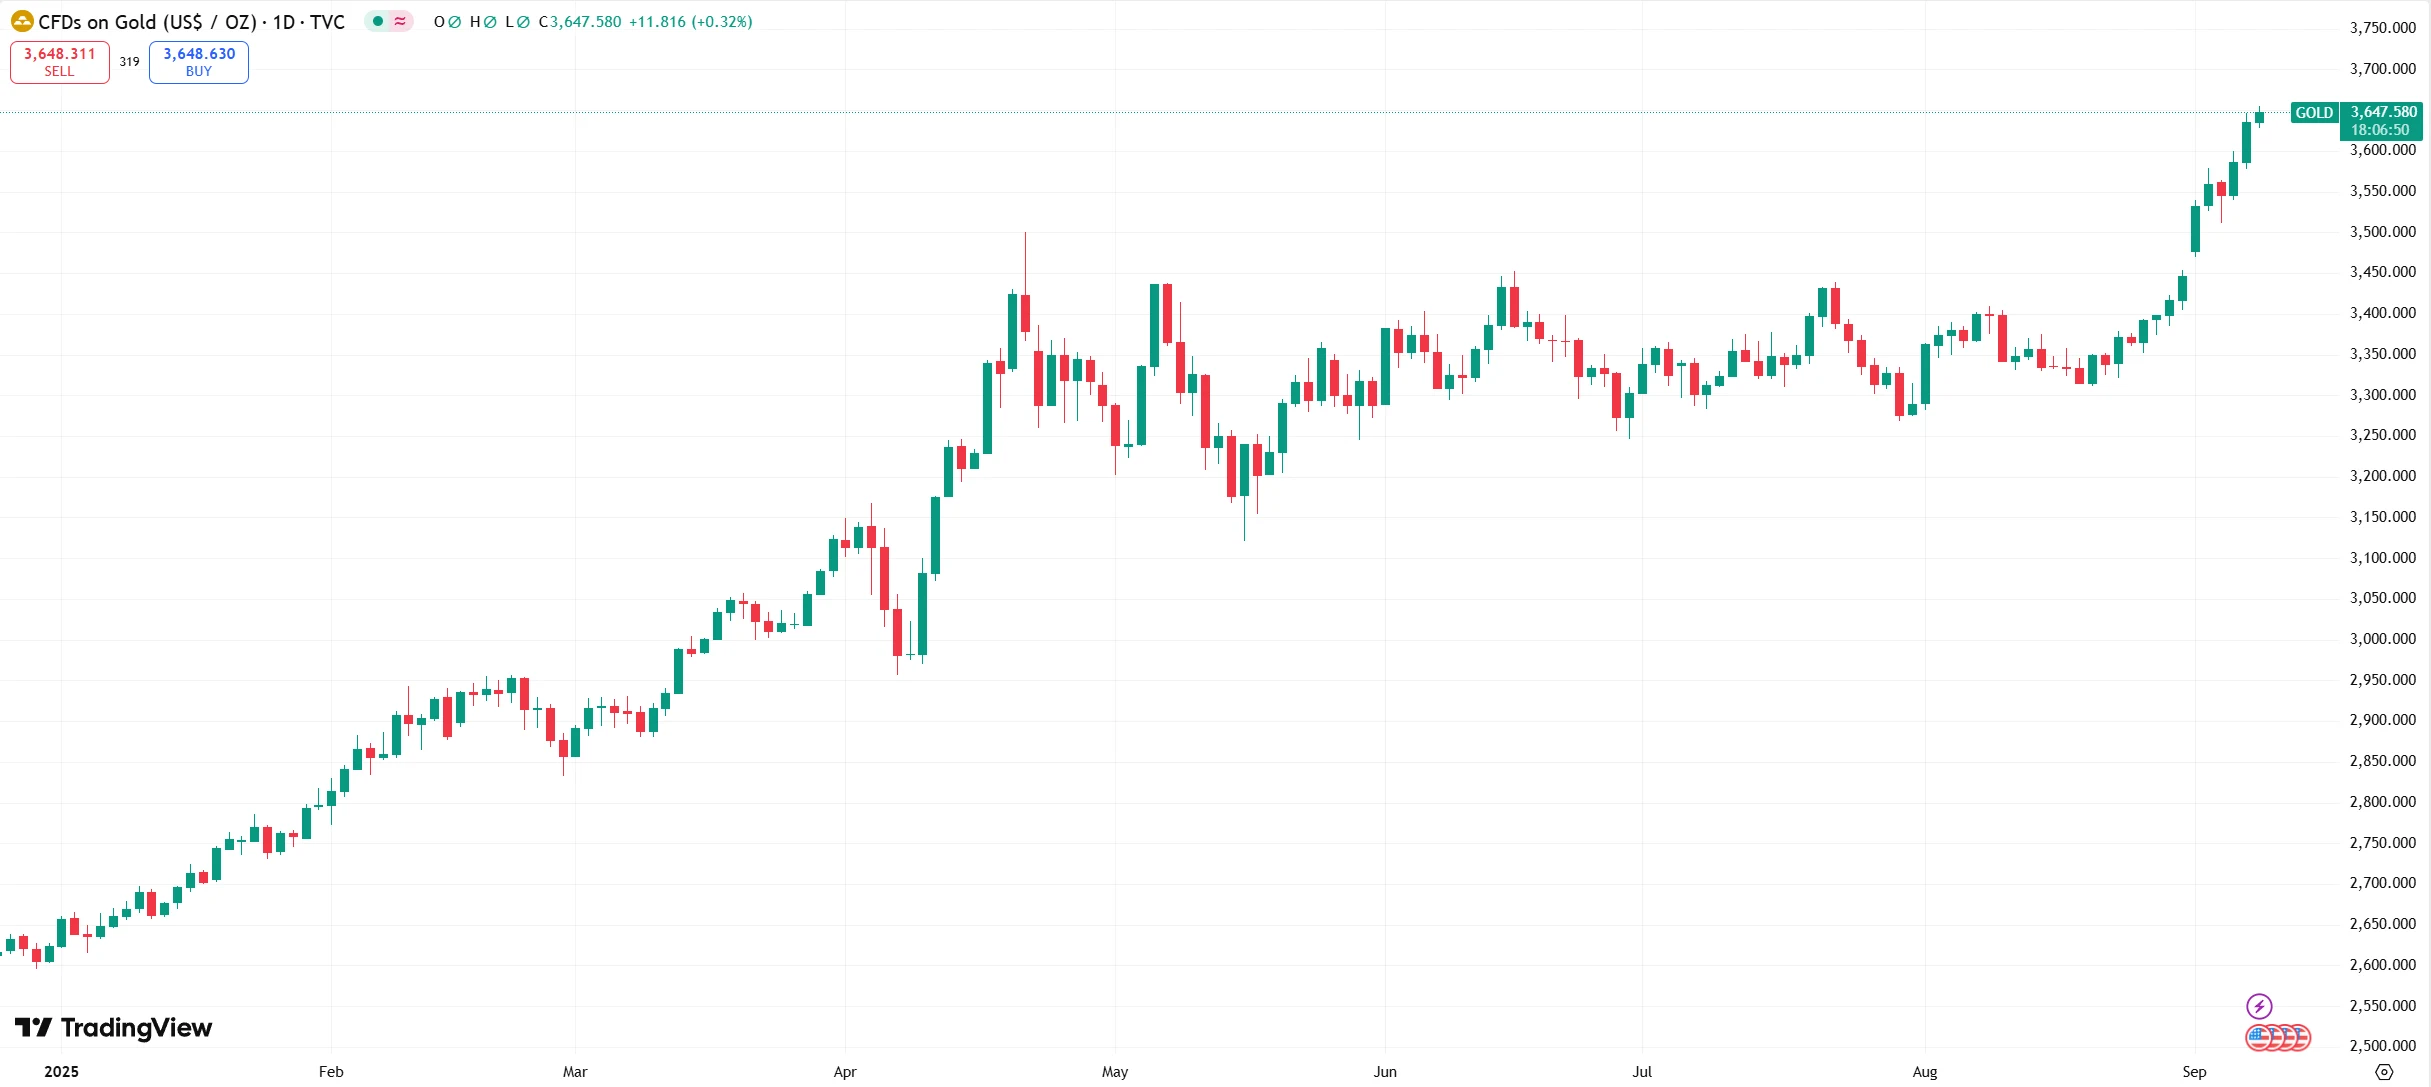
Source: TradingView
Starting from around $2,600 earlier this year, gold has climbed nearly $1,000 in less than nine months, delivering a year-to-date gain of over 38%. This performance has significantly outpaced the S&P 500 Index (10%) and Bitcoin (19%) over the same period, making gold one of the best-performing asset classes of the year.
Gold Hits Record High
Multiple factors have underpinned the current gold bull market and set the stage for further upside.
First, the sharp deterioration in U.S. labor market data has been the primary catalyst driving the latest rally. According to the Bureau of Labor Statistics, nonfarm payrolls increased by just 22,000 in August 2025, well below market expectations of 75,000. Private-sector job creation has averaged only 39,000 over the past four months, marking the weakest stretch since the pandemic.
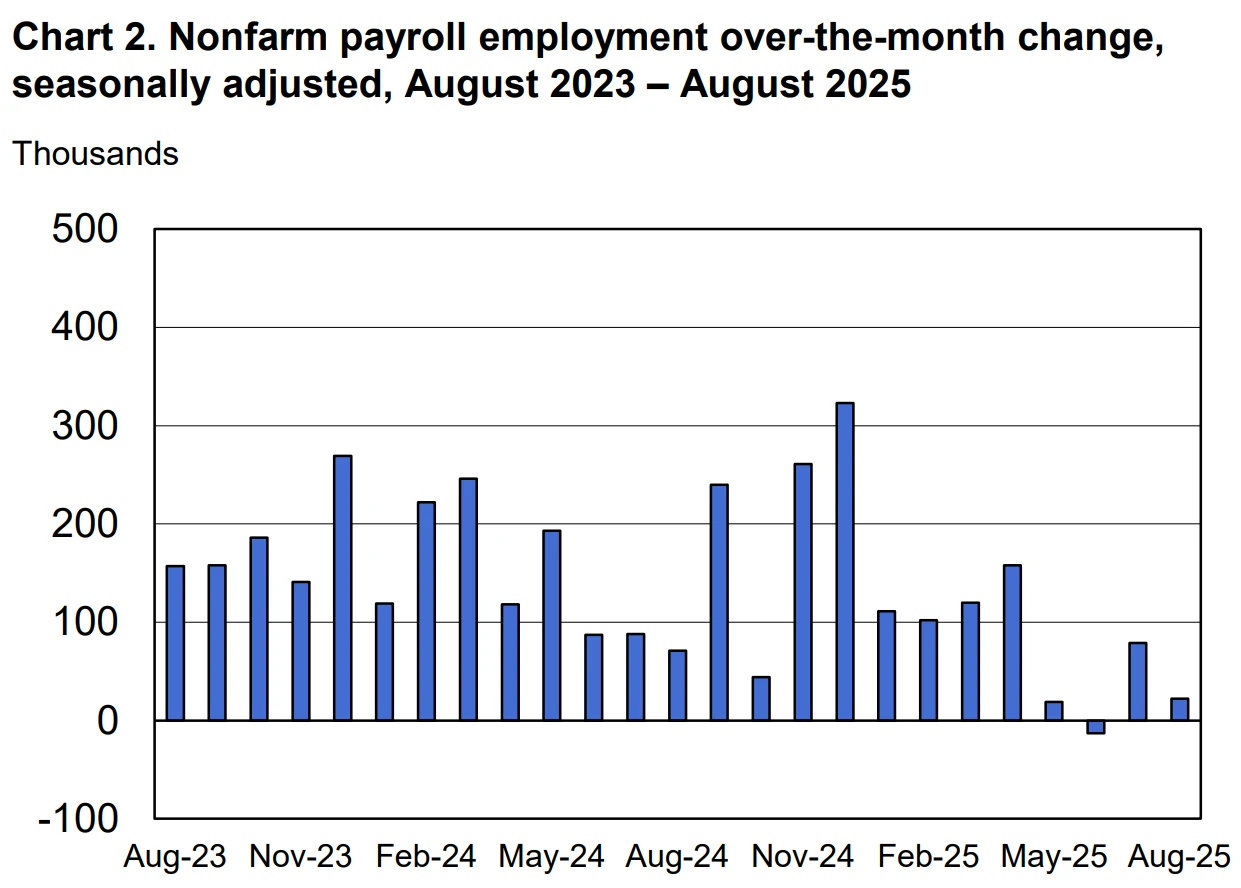
Source: U.S. Bureau of Labor Statistics
At the same time, the unemployment rate climbed to 4.3%, the highest in nearly four years. These figures significantly shifted market expectations for Federal Reserve policy, with earlier forecasts for two rate cuts now revised to three—25 basis points each in September, October, and December. UBS has issued an even more aggressive forecast, projecting four consecutive cuts starting in September, totaling 100 basis points.
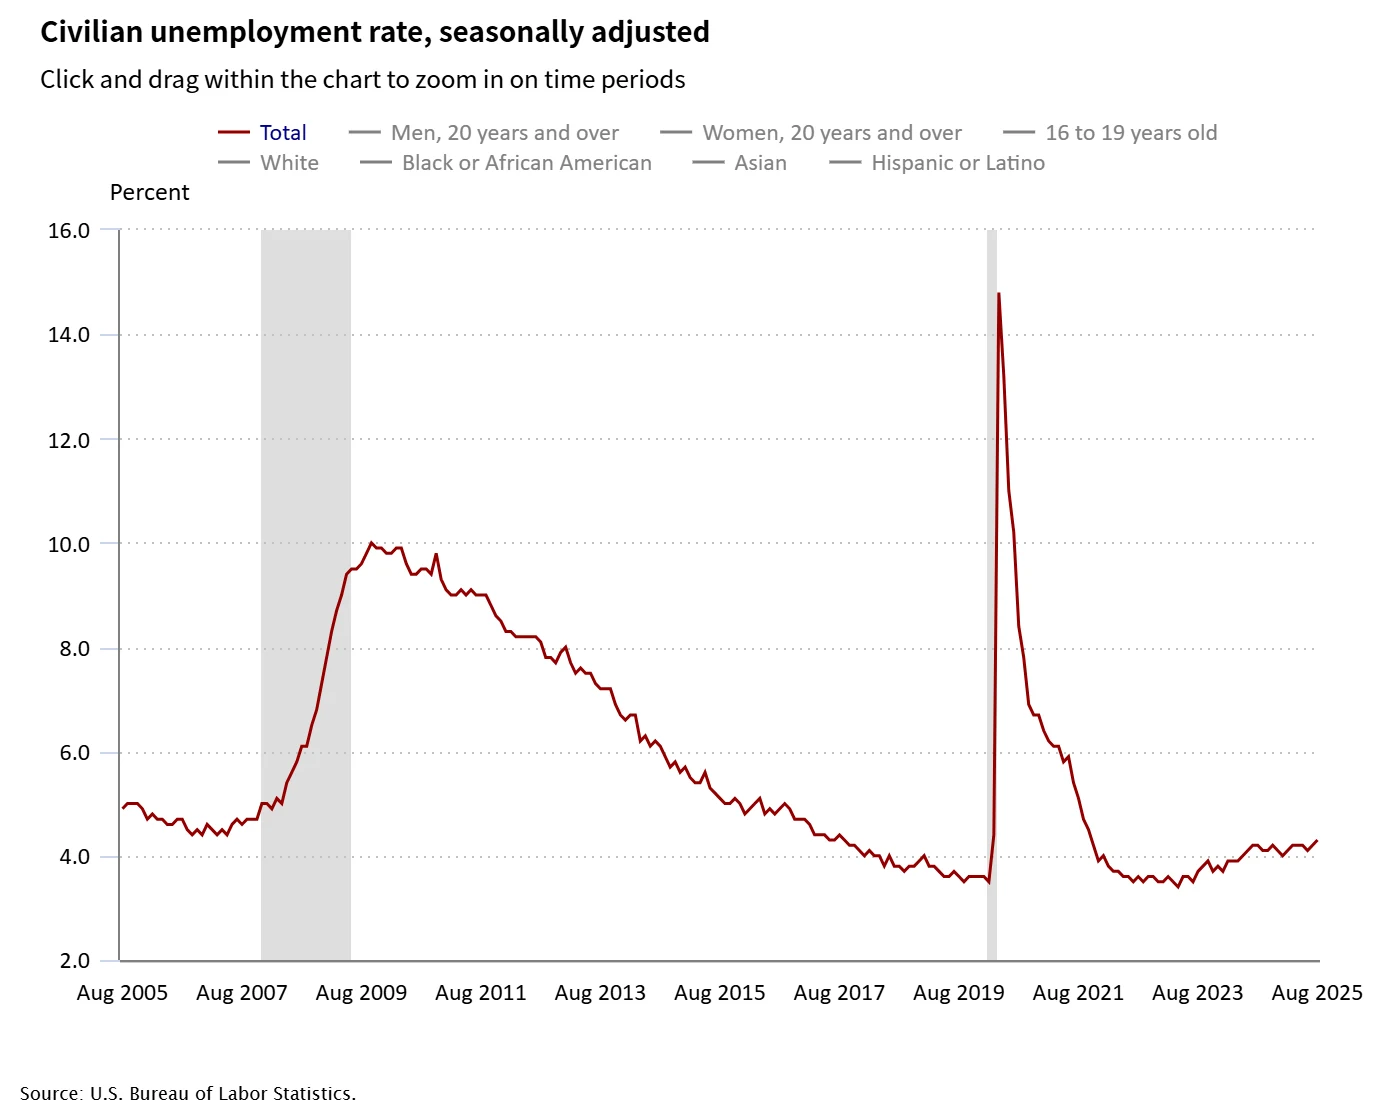
Source: U.S. Bureau of Labor Statistics
According to CME FedWatch data as of September 9, markets now assign an 88.4% probability of a 25-basis-point cut at the Fed’s September 17 meeting, and an 11.6% probability of a larger 50-basis-point cut—the last time such a move occurred was September 2024.
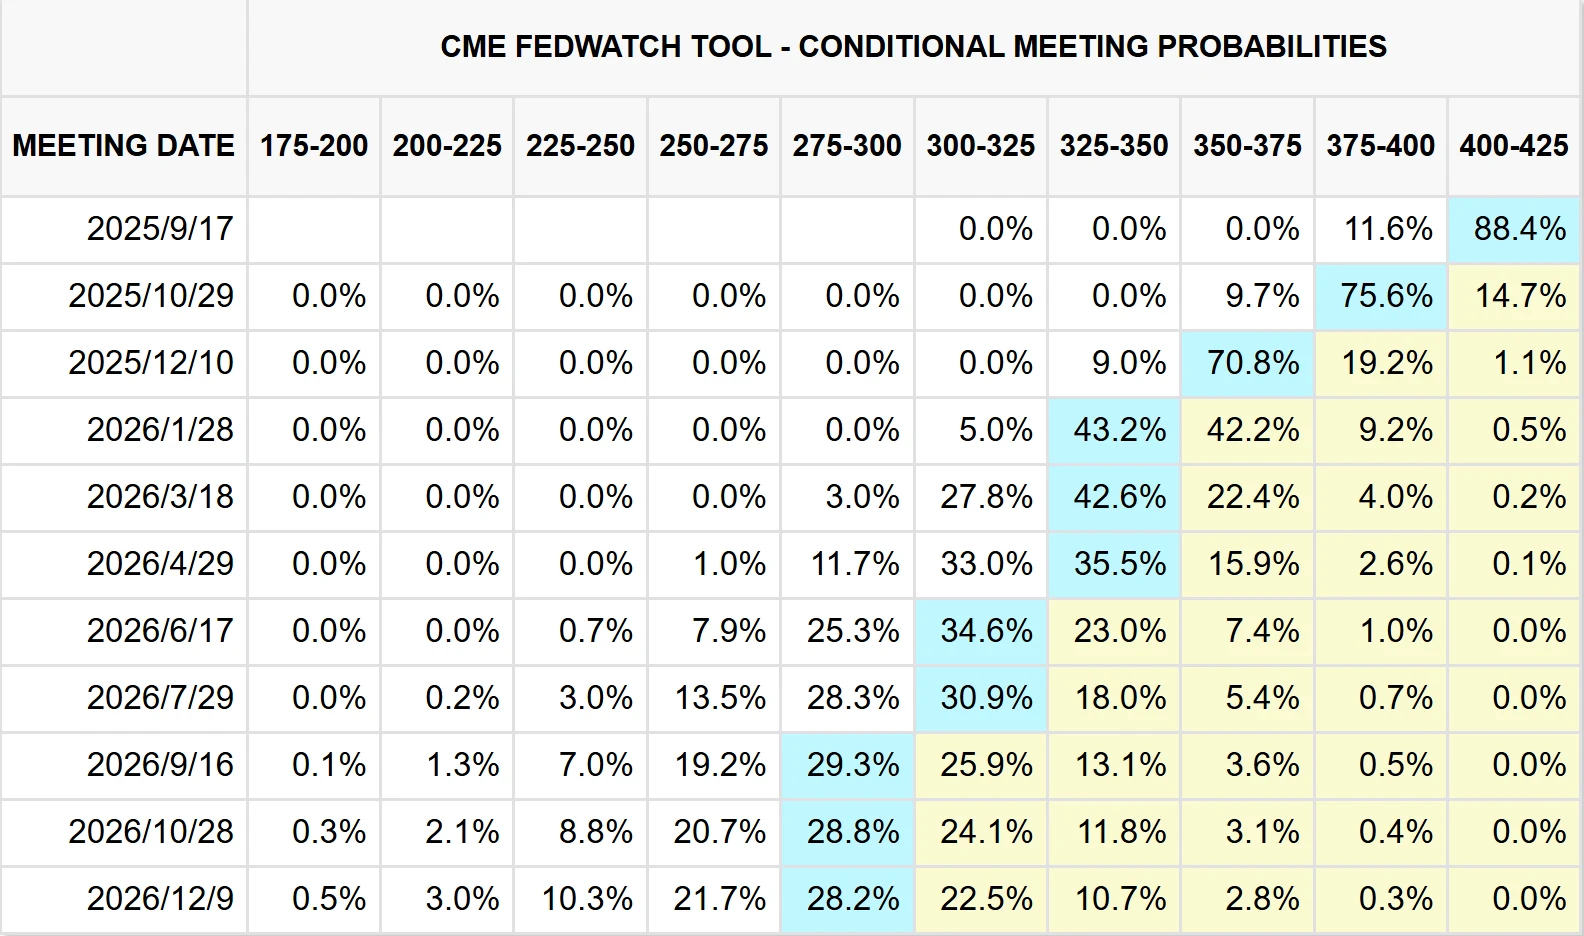
Source: CME
Historically, in the 12 rate-cut cycles since 1970, gold prices have tended to rise in the one to three months preceding a cut, with an average gain of 8%. However, once cuts were implemented, gold’s performance became more mixed, with maximum gains of 43% and declines of up to 24%. This suggests that the market may already be pricing in the benefit of rate cuts. Unlike previous cycles, however, the current easing outlook is unfolding against a more complex backdrop—White House tariff policies are amplifying recession risks, further highlighting gold’s role as a recession hedge.
Central bank demand has provided another critical pillar of support. In the first half of 2025, global central banks made net purchases of 123 tons of gold, extending the buying trend that began in 2022. The People’s Bank of China has been particularly notable, adding to reserves for 10 consecutive months through August, lifting holdings to 74.02 million ounces, up 600,000 ounces from July. Importantly, gold accounts for just 7.3% of China’s official reserves, well below the global average of around 15%, leaving ample room for further accumulation.
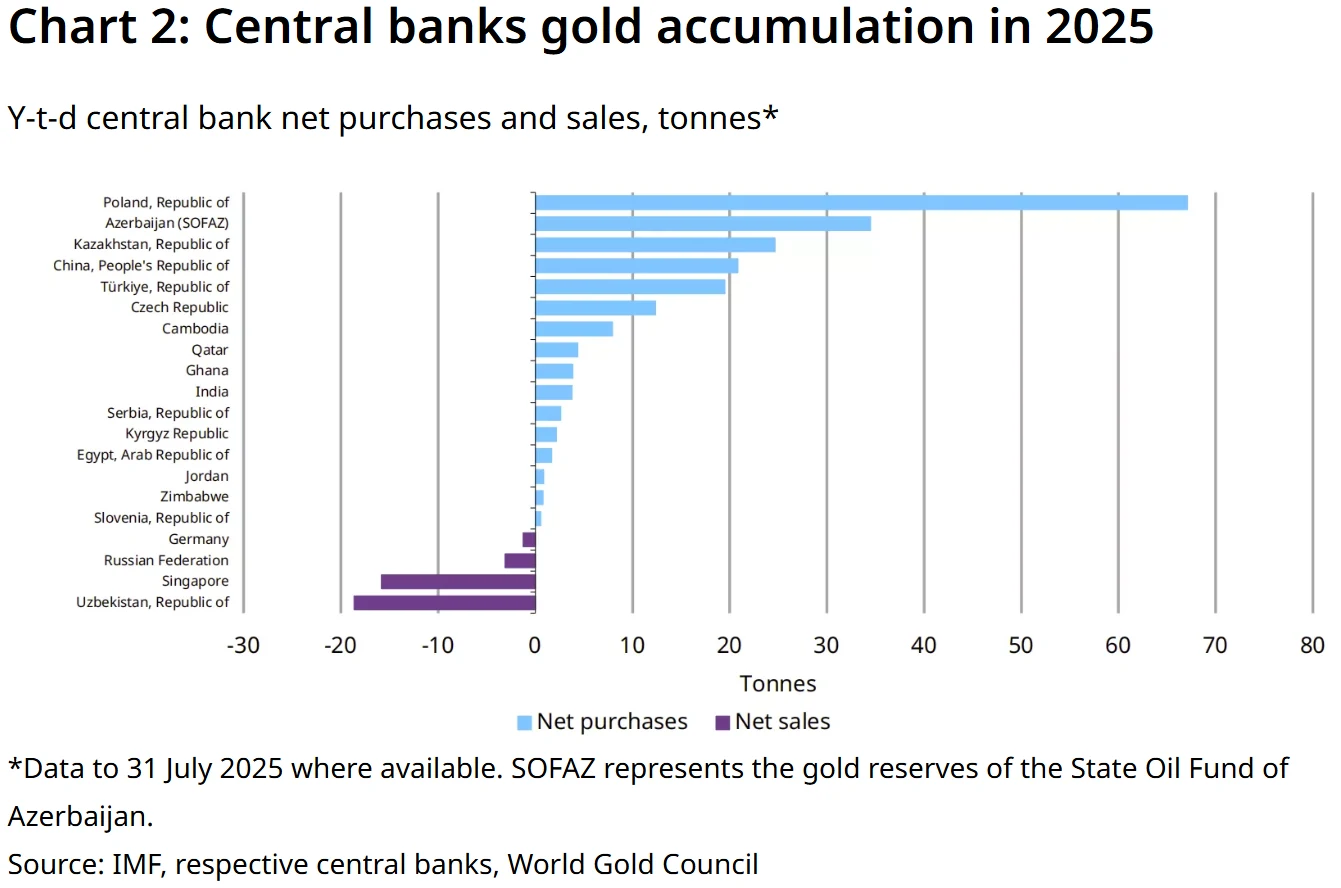
Source: World Gold Council
Equally significant is the accelerating trend of global “de-dollarization.” With total U.S. federal debt surpassing $37 trillion for the first time, concerns about the U.S. dollar’s creditworthiness have intensified. The dollar index has been in decline since the start of the year. Central banks worldwide are increasingly diversifying reserves by adding gold, reducing reliance on a single currency. This strategic allocation provides a stable source of demand, complementing speculative inflows and driving prices higher. According to the World Gold Council, global central bank gold purchases exceeded 1,000 tons for the third consecutive year in 2024—an unprecedented scale that has reshaped the supply-demand dynamics of the gold market.
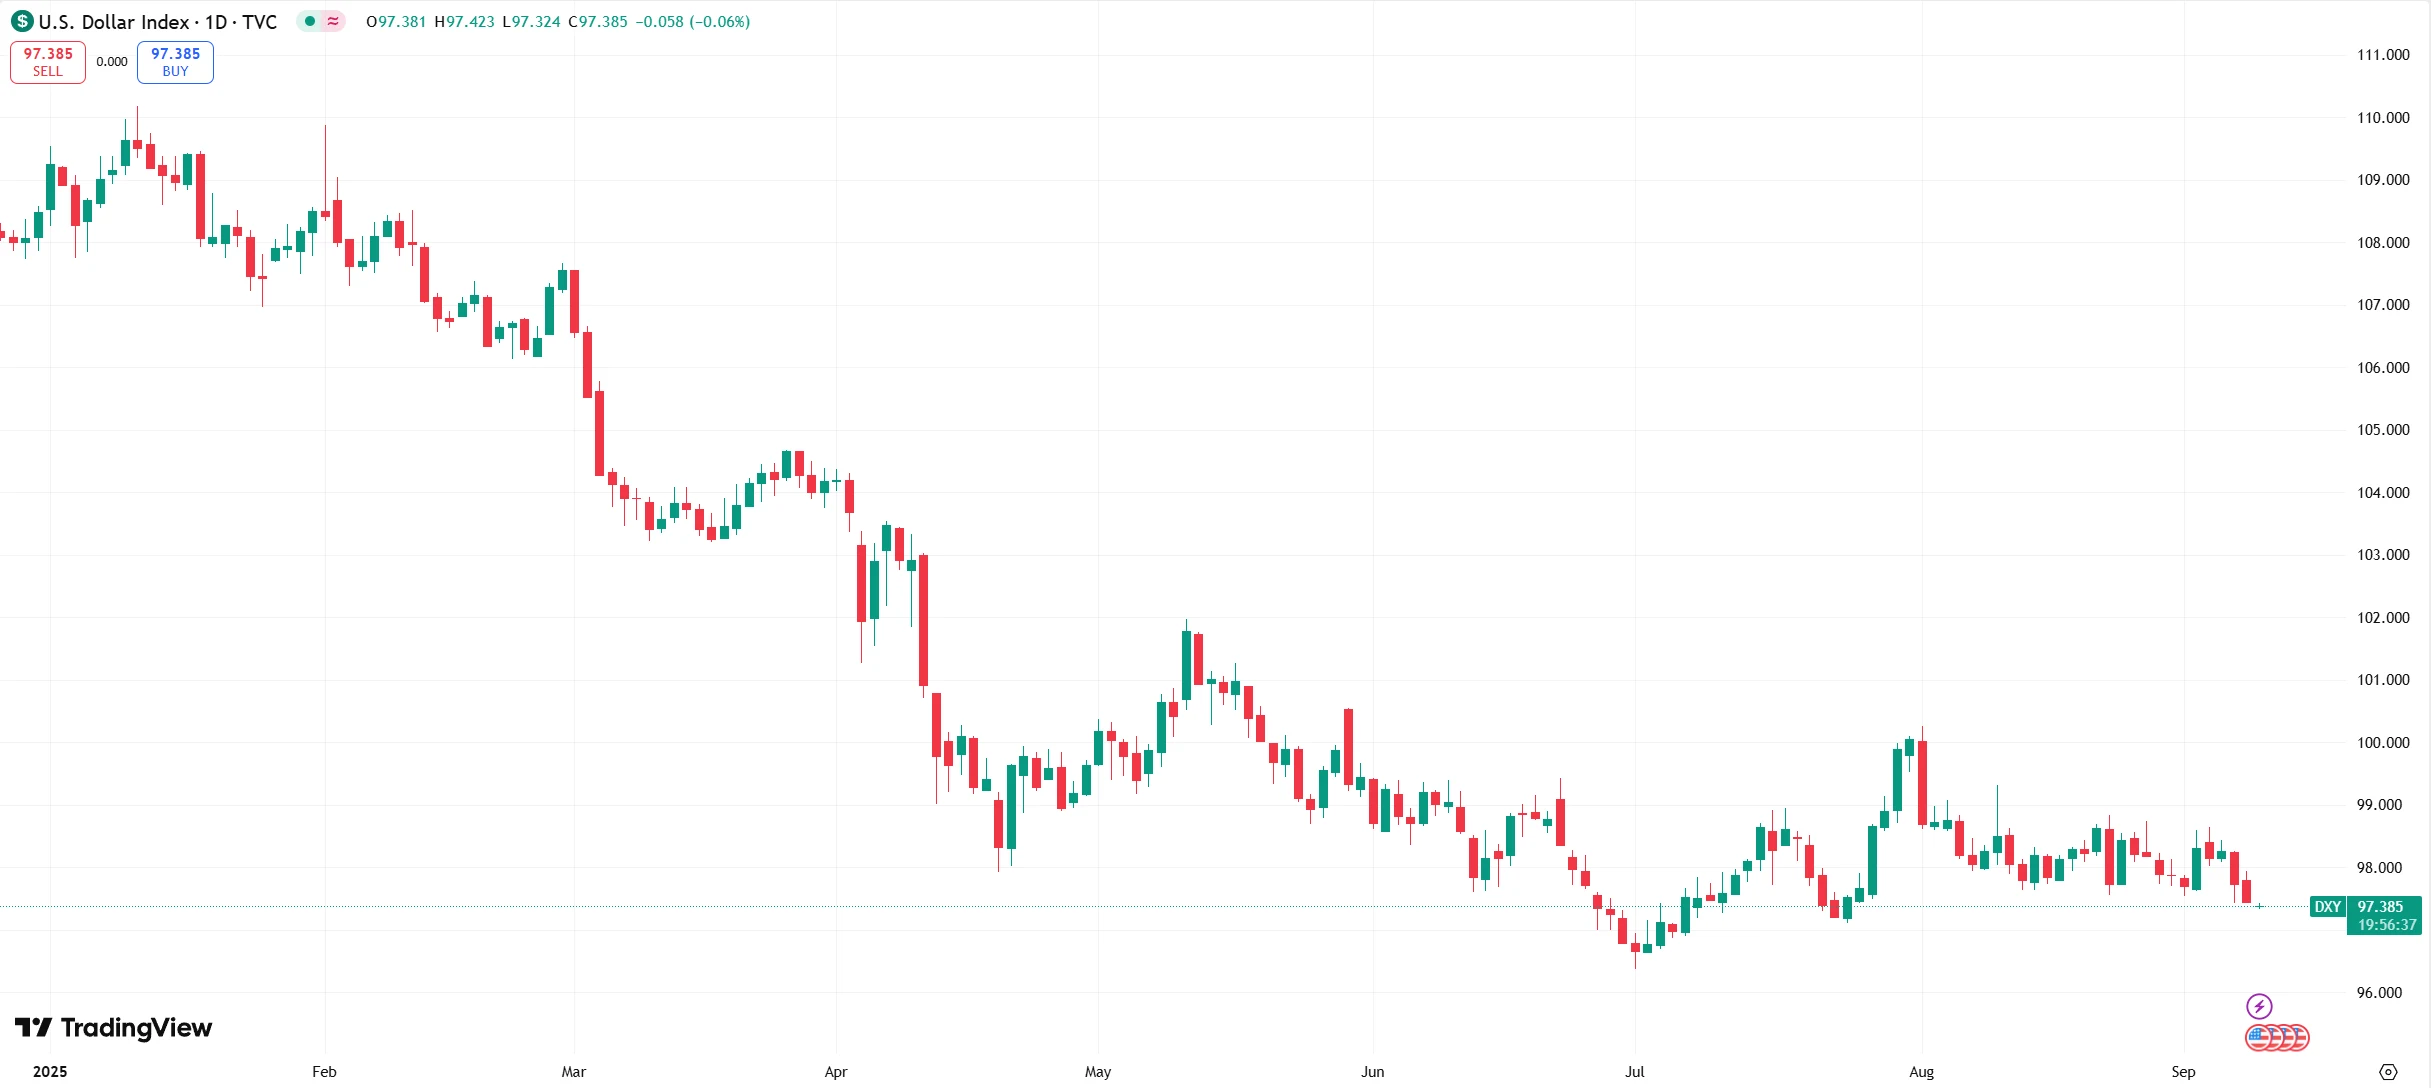
Source: TradingView
Rising investor risk aversion has also amplified gold’s momentum. In August 2025, global gold ETFs recorded net inflows of $5.5 billion, led by North America and Europe, reflecting growing institutional demand. These flows are closely tied to geopolitical risks, with escalating tensions in the Middle East and the ongoing war in Ukraine increasing uncertainty and boosting gold’s safe-haven appeal.
At the same time, market narratives have been shifting from a “rate-cut trade” to a “recession trade.” Analysts note that the recent surge in ultra-long bond yields in the U.K., France, and Germany—triggering broad sell-offs—reflects investor concerns about a second wave of inflation risks driven by tariff policies. Structural debt risks are also coming into sharper focus, as elevated interest burdens and rising social welfare costs tied to aging populations constrain both economic recovery and fiscal flexibility. Against this macro backdrop, gold’s dual role as an inflation hedge and a safe-haven asset has become increasingly reinforced.
Technicals Signal Overbought Conditions
From a technical perspective, gold prices are exhibiting a classic strong bullish pattern, though the market has now entered overbought territory, suggesting a potential consolidation phase before the next leg higher.
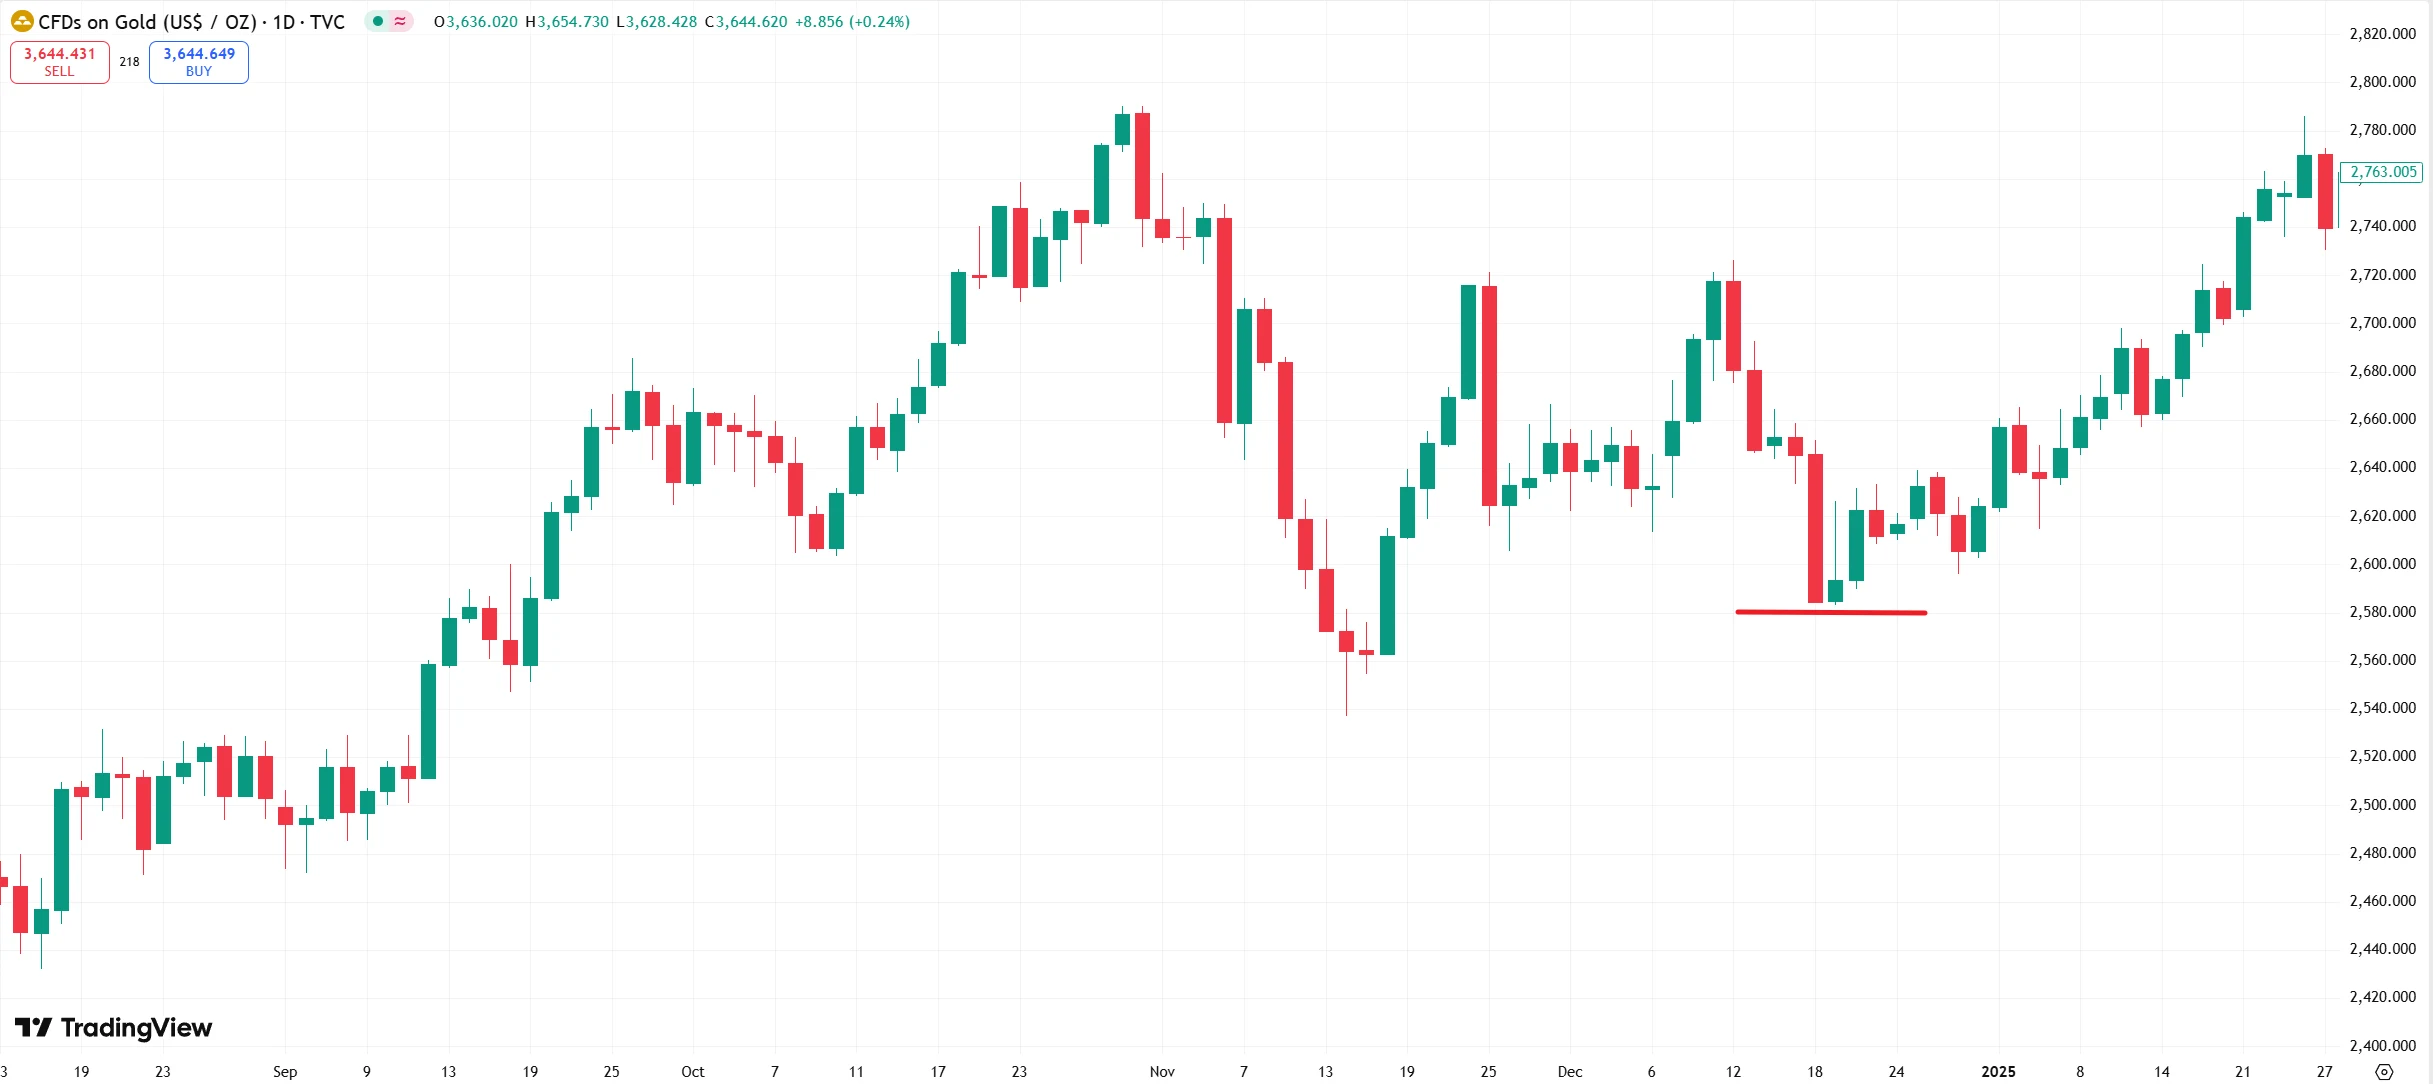
On the daily chart, gold continues to trend steadily higher along short-term moving averages, with the broader moving average system aligned in a bullish formation. Each moving average is trending upward and spreading apart—a strong signal of trend continuation. The widening Bollinger Bands indicate that momentum remains dominant, with the recent high of $3,655.5 serving as immediate resistance and a key battleground between bulls and bears. On the downside, the $3,583–$3,550 range forms the first support zone, while the mid-Bollinger band at $3,430 represents the medium-term support line.
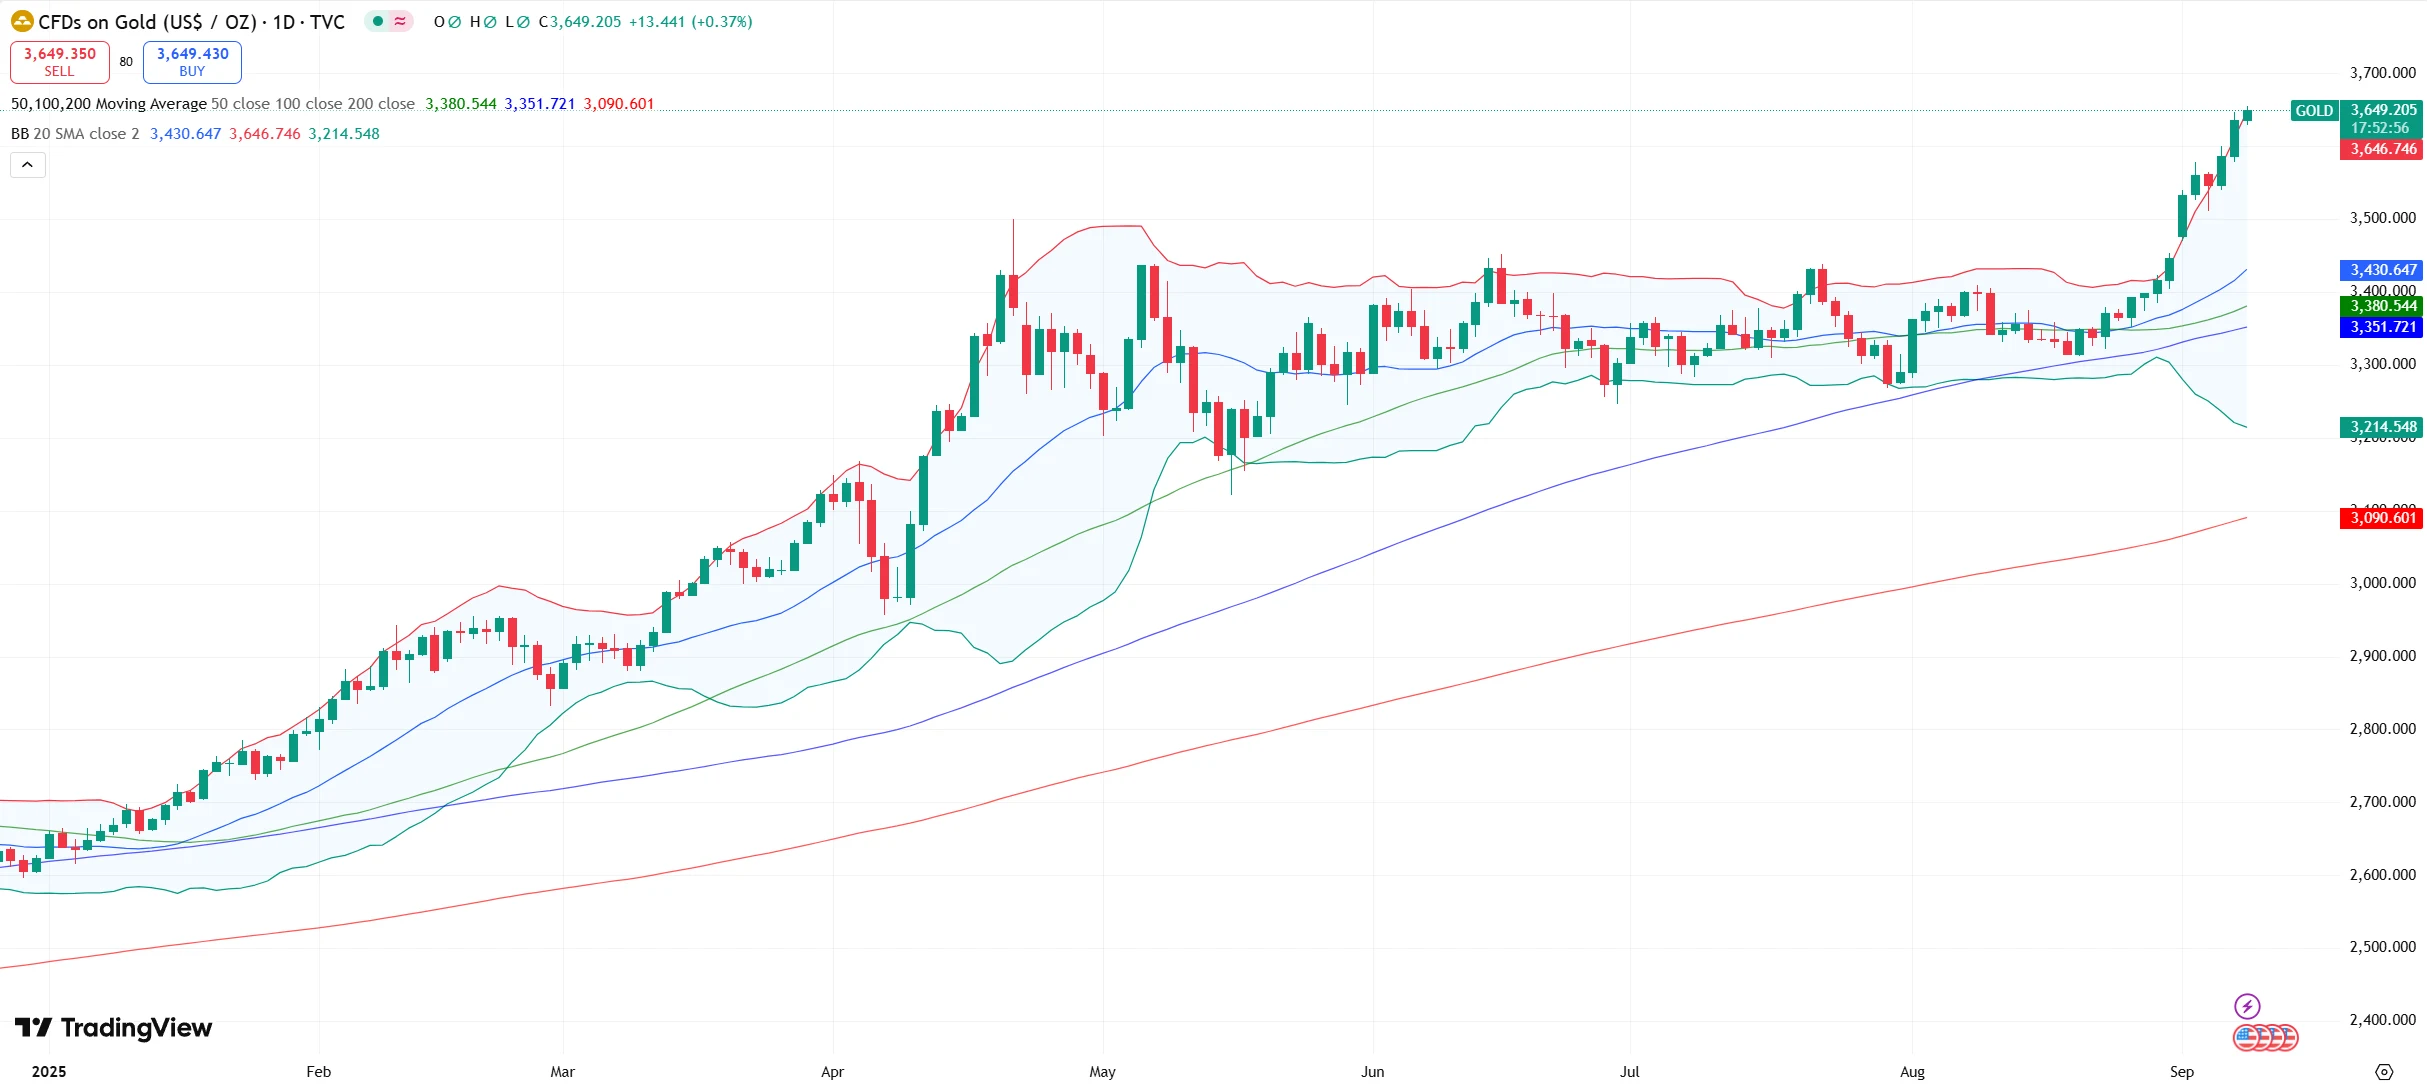
Source: TradingView
Momentum indicators reinforce the bullish picture. The MACD suggests strong upward momentum, while the Relative Strength Index (RSI, 14) has climbed to 79.65, well into overbought territory, signaling the potential need for a pullback or sideways consolidation in the near term.
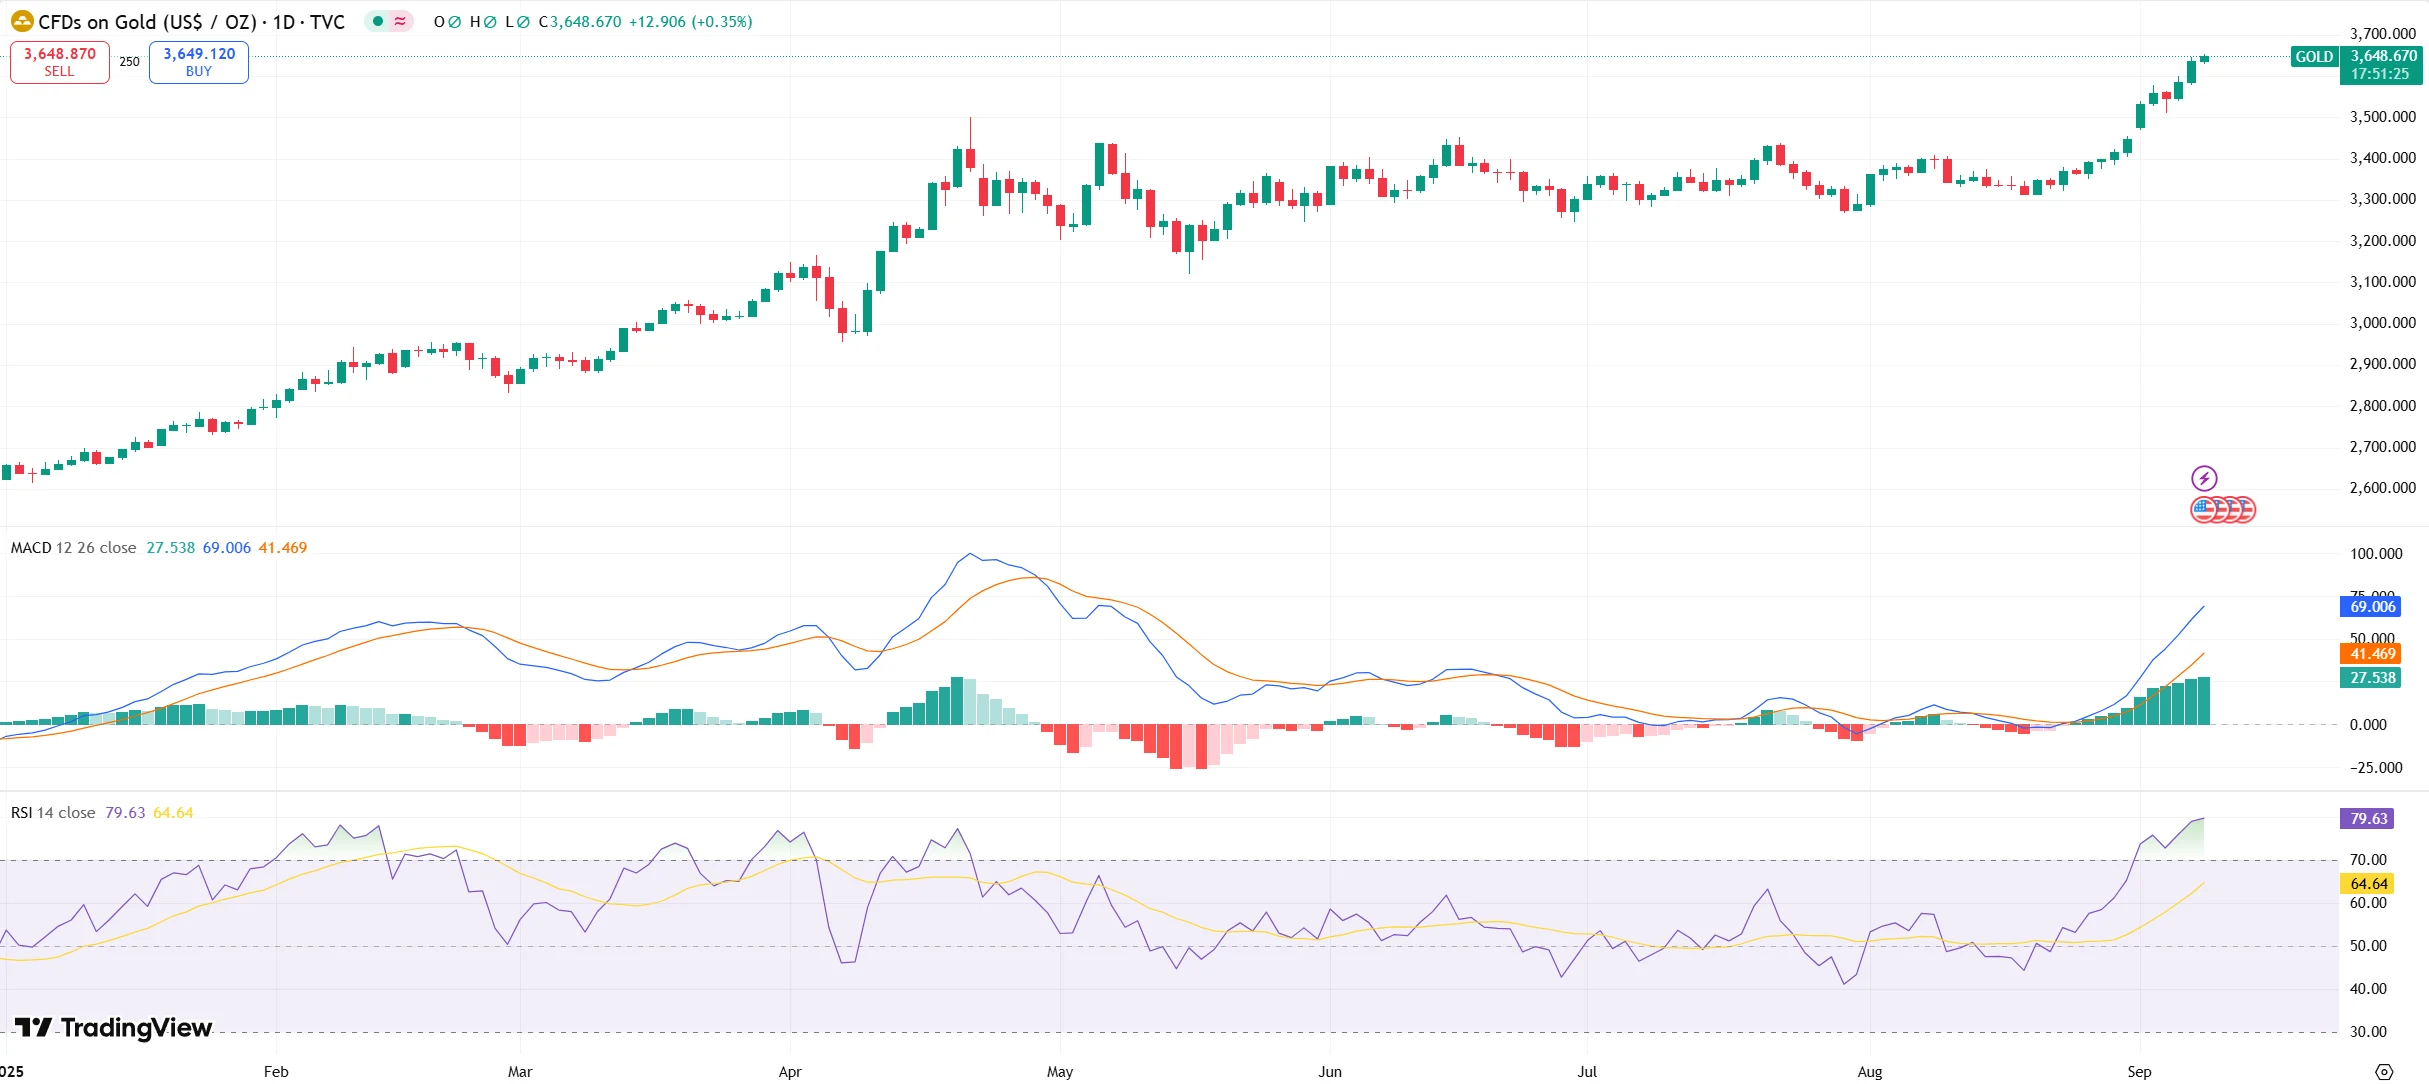
Source: TradingView
A look back at historical patterns highlights the risk of near-term profit-taking. In late February 2025, when COMEX gold approached the $3,000 mark, the RSI similarly entered overbought levels, followed by a correction of more than 4%. This precedent suggests that rapid price gains could again trigger selling pressure.
Shorter timeframes offer additional nuance. On the four-hour chart, gold staged a second leg higher after consolidating at elevated levels. Although the one-hour chart shows some weakening momentum, no sharp reversal has emerged, and the broader bullish tone remains intact. After decisively breaking through $3,600, gold extended gains above $3,640. Key near-term support sits at the $3,600 level—a former resistance now turned support—closely aligned with the rising mid-Bollinger band. Additional layered supports are visible at $3,606, $3,601, and $3,595.
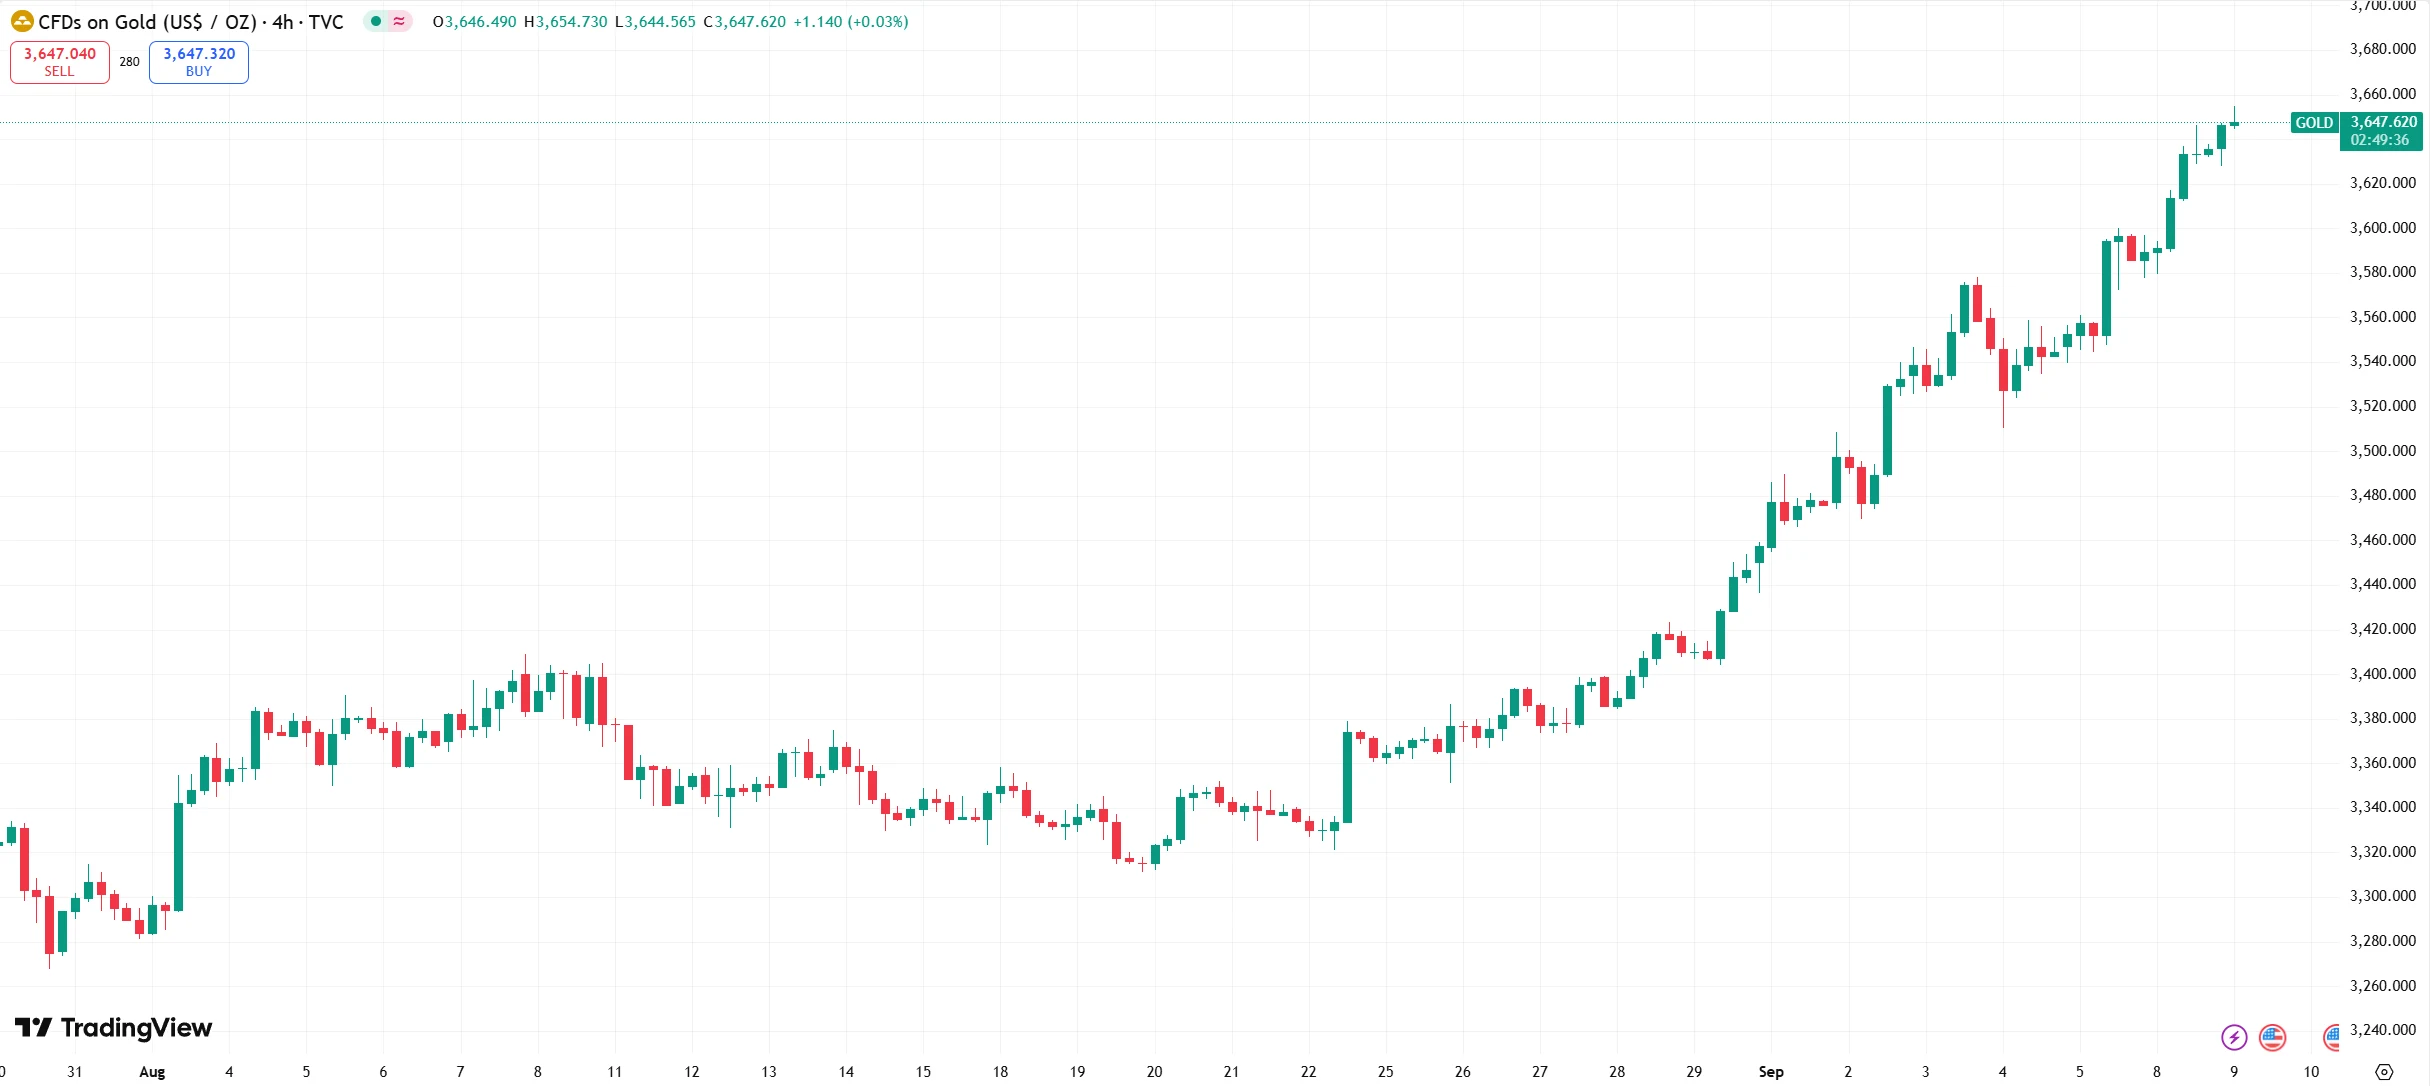
Source: TradingView
Taken together, multi-timeframe analysis confirms a well-established bullish trend but warns that overbought conditions could magnify short-term volatility. Historically, overbought signals can persist for extended periods in strong uptrends, making the defense of key support levels critical. If $3,600 holds, the rally is likely to extend; a break below could open the door to a deeper pullback toward the $3,550 zone.
Wall Street Remains Bullish on Long-Term Prospects
Although gold has already reached record highs, institutions remain optimistic about its outlook, with several major investment banks raising their price targets.
Goldman Sachs forecasts that gold will rise to $3,700 per ounce by the end of 2025 and climb further to $4,000 by mid-2026. The bank’s projection is based on expectations of continued robust central bank demand. In the fourth quarter of 2024 alone, central banks purchased 332.9 tons of gold—the third-largest quarterly reserve expansion on record.
Morgan Stanley analysts, in a September 1 research note, highlighted multiple tailwinds—including the start of a Federal Reserve rate-cutting cycle, sustained dollar weakness, renewed ETF inflows, and recovering physical demand—that could propel gold prices higher. They set a fourth-quarter 2025 target of $3,800 per ounce.
JPMorgan’s outlook is even more bullish, projecting that gold will surpass $4,000 per ounce in 2026, and cautioning that this milestone could arrive “sooner than expected.” From a historical perspective, such forecasts are not without precedent—between November 2022 and September 2025, gold has already rallied as much as 84%. Should this momentum continue over the next year, the $4,000 target appears increasingly within reach.
Bottom Line
As of publication, spot gold was trading near $3,652 per ounce. Market attention is now turning to the latest U.S. inflation data due later this week, as well as the Federal Reserve’s upcoming Federal Open Market Committee (FOMC) meeting on September 16–17.
Although rate-cut expectations are currently elevated, historical evidence suggests gold’s reaction to actual policy moves can be uncertain. Following the Fed’s 25-basis-point rate cut in December 2024, spot gold briefly fell below $2,600 per ounce, sliding more than 2% intraday in what was perceived as a “hawkish cut.” This underscores the importance of the September 17 policy statement and updated dot plot. A more dovish signal could open further upside for gold, while an emphasis on inflation risks and limits to future easing could trigger a pullback.
Source: TradingView
That said, the long-term outlook for gold remains constructive. Persistent central bank demand, the ongoing de-dollarization trend, and elevated geopolitical risks are expected to continue supporting prices over the medium to long term.
Disclaimer: The content of this article does not constitute a recommendation or investment advice for any financial products.

Email Subscription
Subscribe to our email service to receive the latest updates
