Spot Silver Price Surpasses $40/oz, Reaches Highest Level Since 2011
![]() FoolBull
FoolBull
12:00 August 31, 2025 EDT
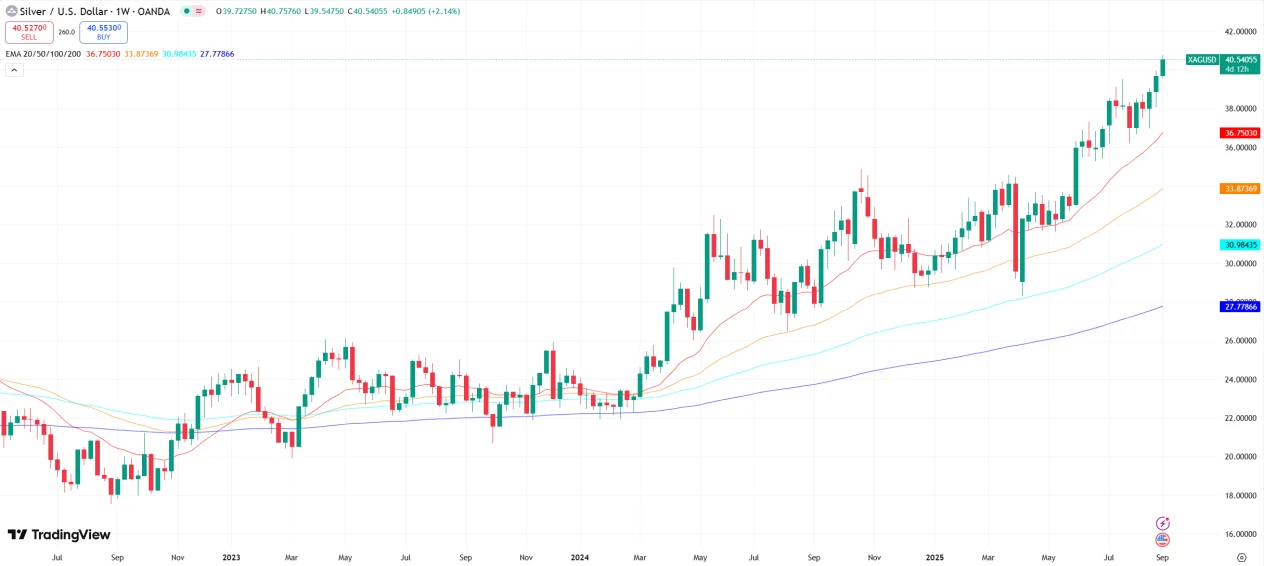
On September 1, 2025, the spot silver price broke through and firmly held above the $40/oz psychological level, marking a new high since September 21, 2011. This milestone signals that the silver market has entered a new phase. Historically, silver reached a peak of $49.82/oz on April 28, 2011, with an annual average of $35.13/oz at that time, while the 2024 annual average price had risen to approximately $28.70/oz, indicating a long-term upward trend.
As of the time of writing, the London spot silver price is quoted at $40.703/oz, up $0.919 from the previous trading day, representing a 2.31% gain. Intraday, prices reached a high of $40.796/oz and a low of $39.747/oz.
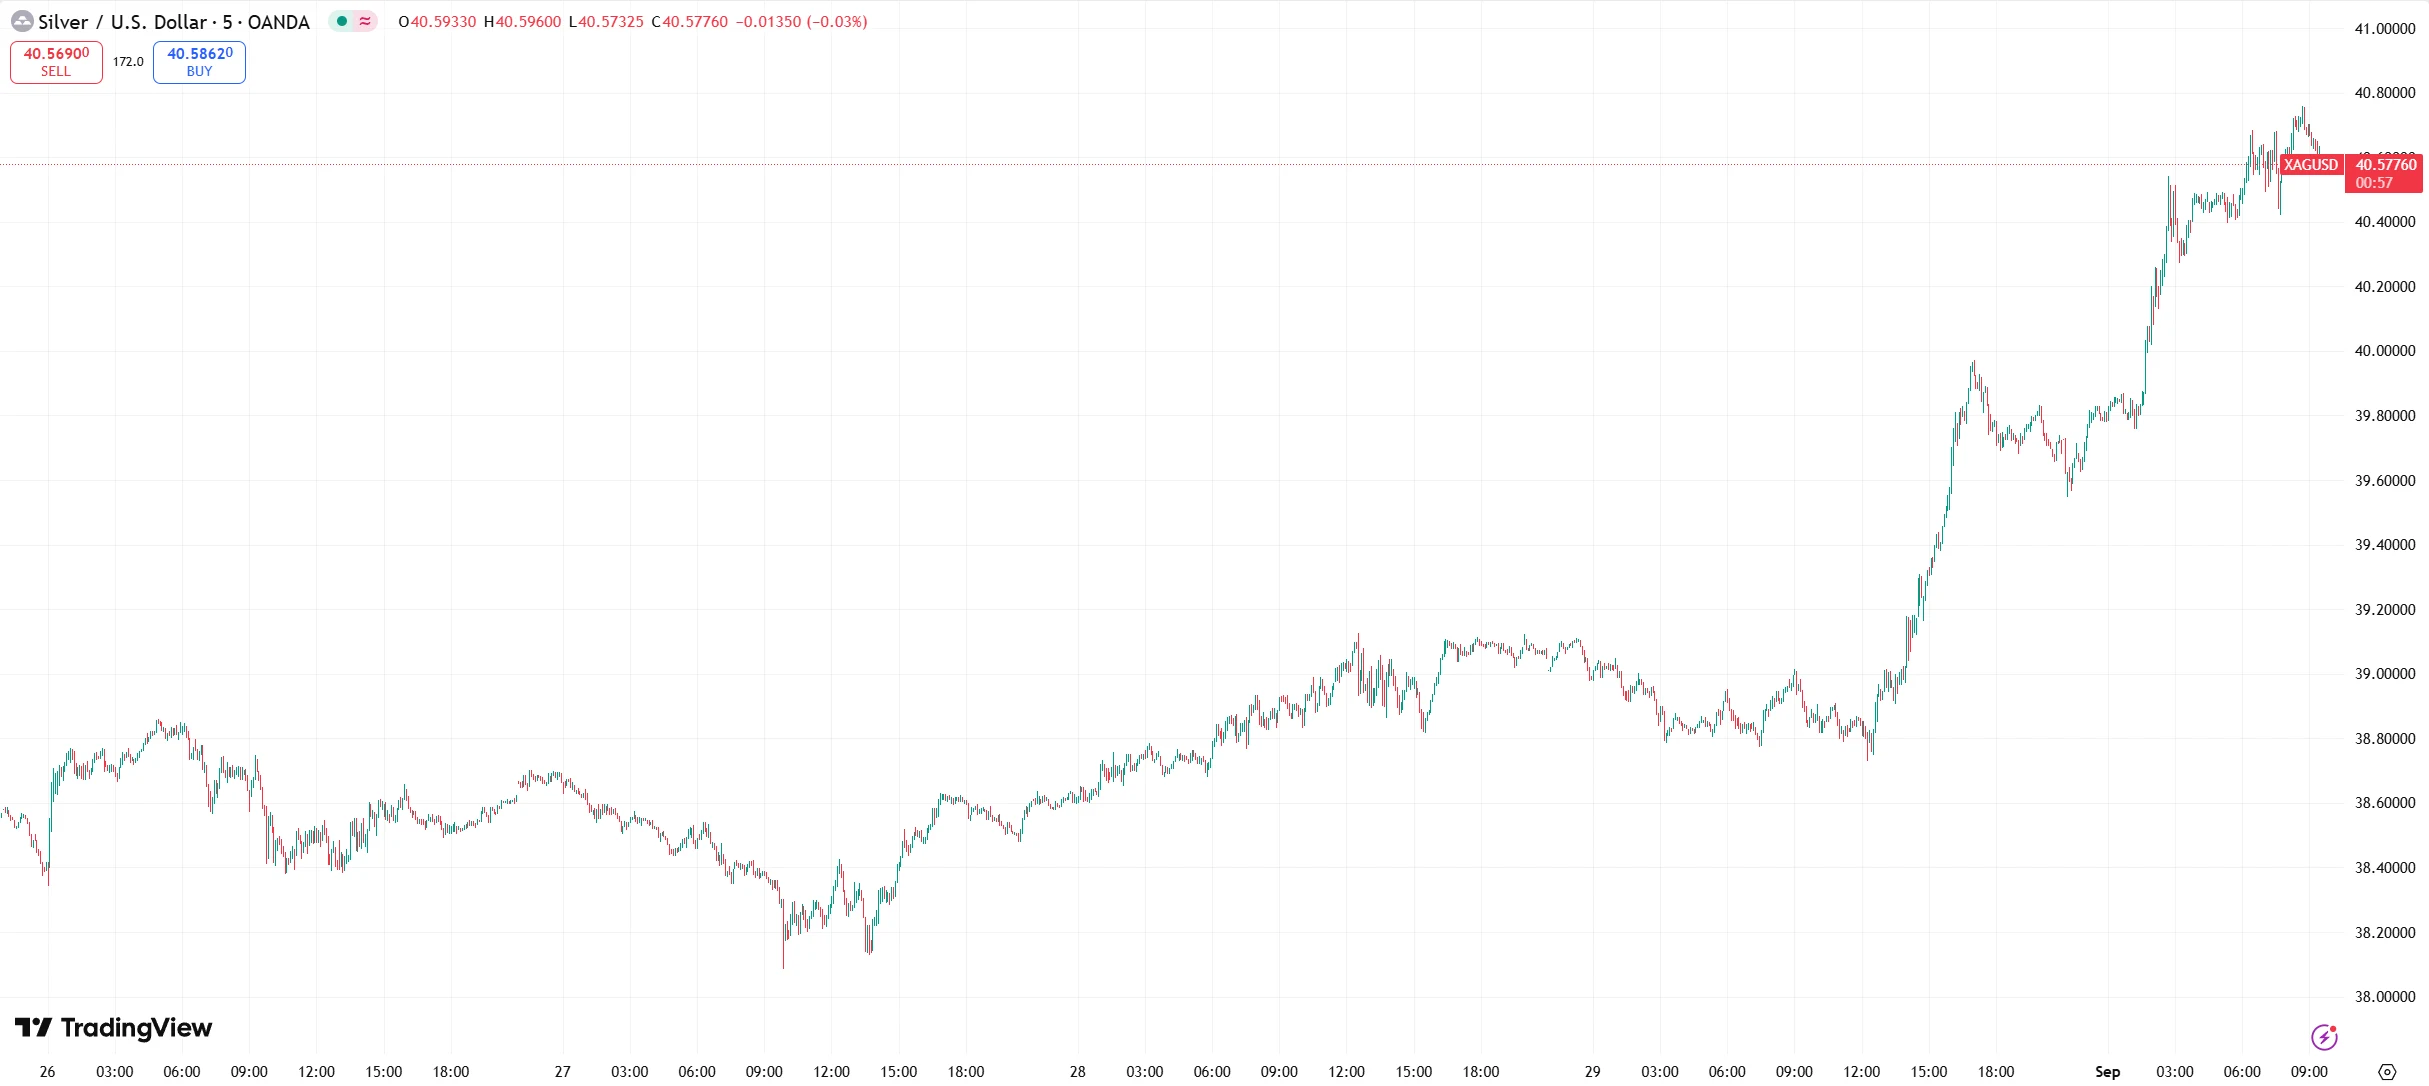
Source: TradingView
From a technical perspective, the spot silver breakout above $40/oz carries a clear trend confirmation signal. Hourly charts show that silver formed a short-term low at $38.066/oz and has since staged a steady recovery. After breaking the previous high at $39.039/oz and the $39.10/oz resistance zone, prices successfully climbed above the $40/oz level, completing a key resistance breakout. This move was accompanied by a notable increase in trading volume, with the London spot silver turnover on the day rising 45% above the five-day average, reflecting strong buying momentum.
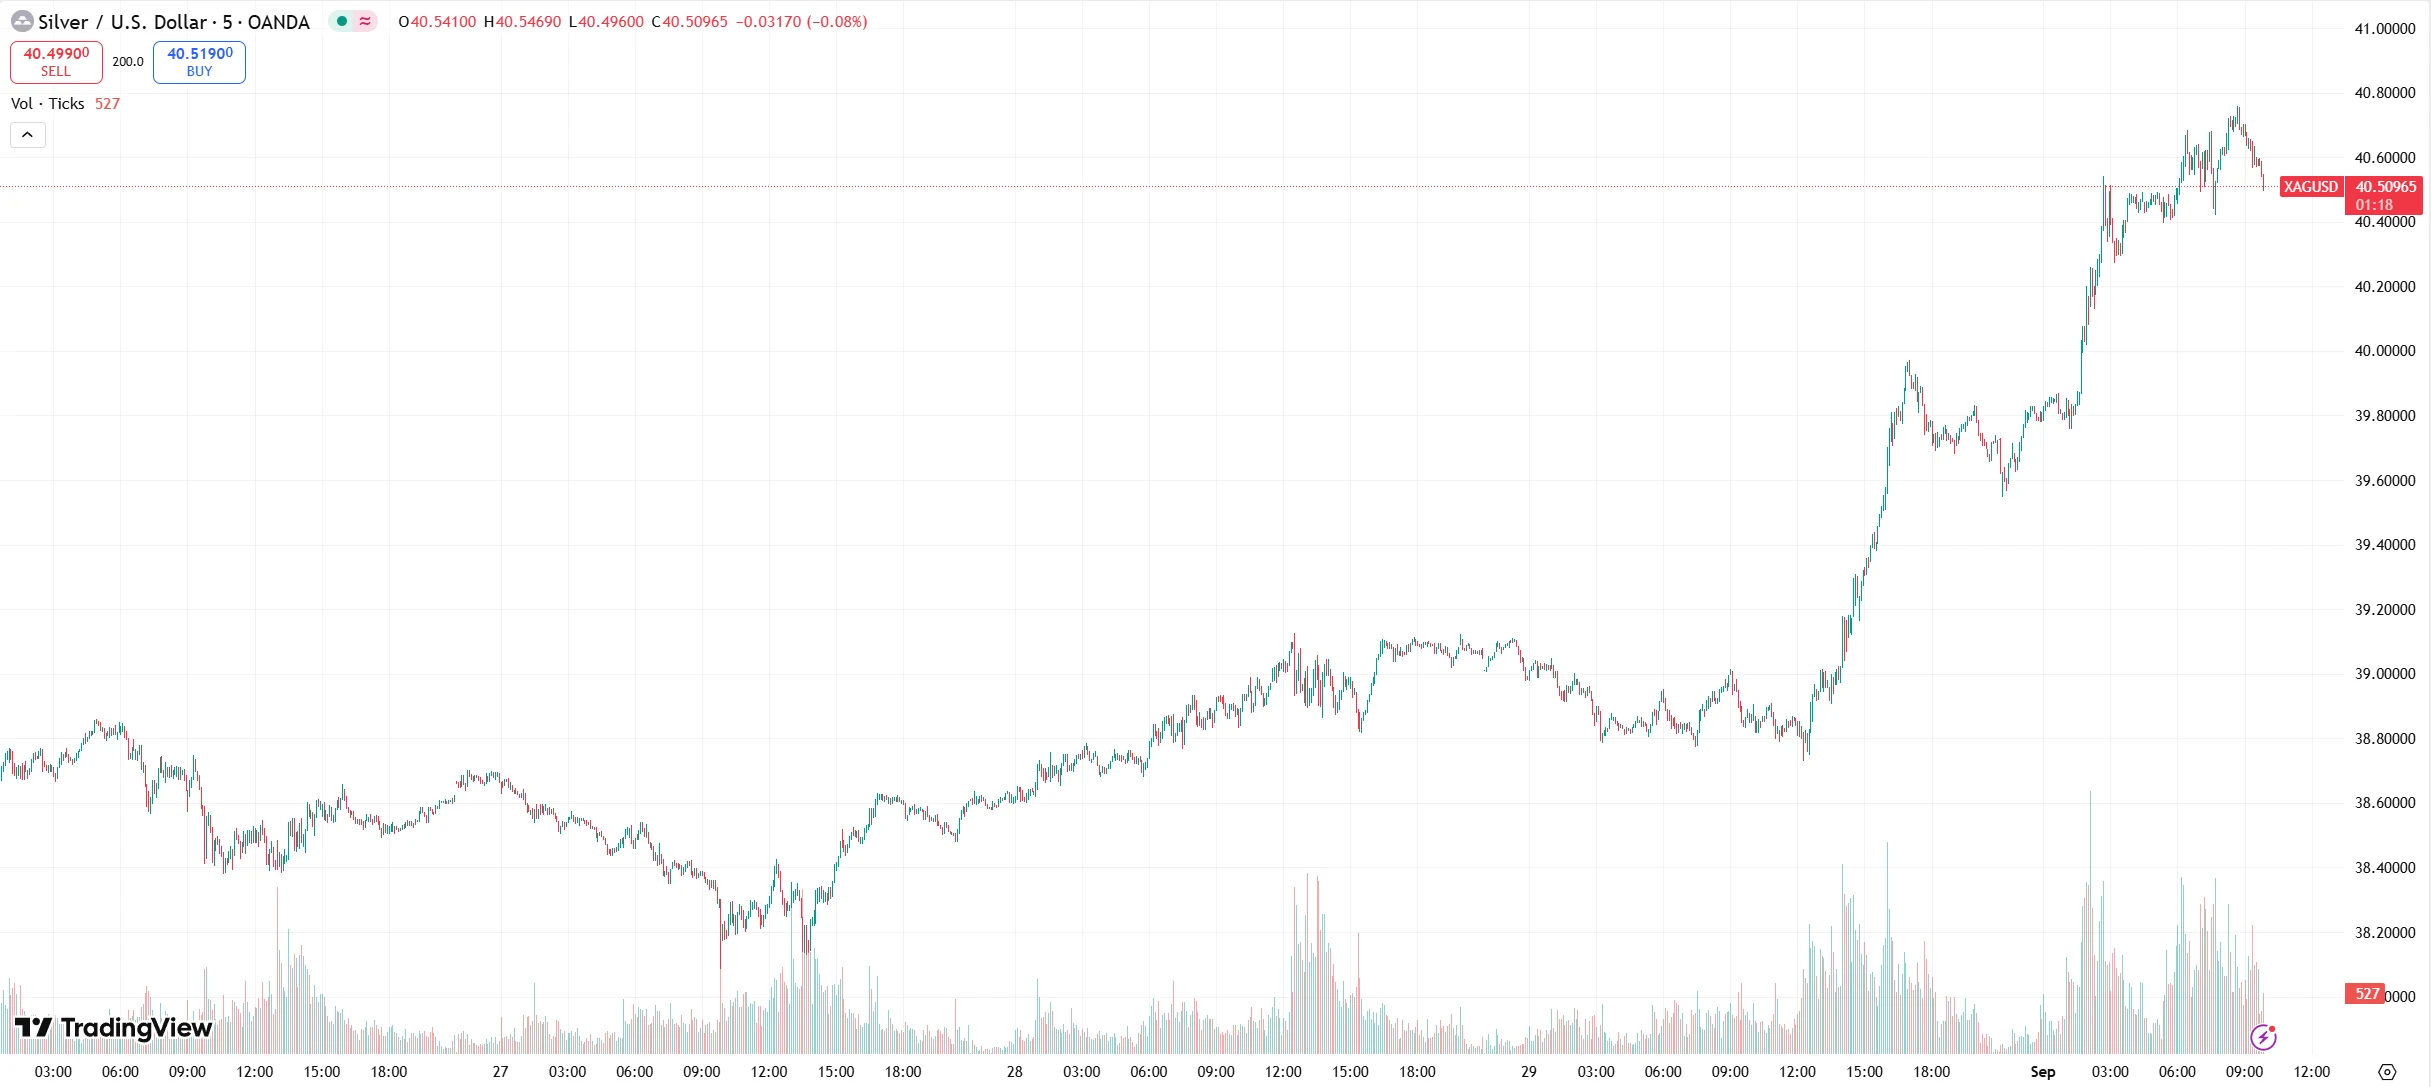
Source: TradingView
Momentum indicators indicate that the market remains under bullish control, although short-term overbought risks should be monitored. On the MACD, the DIFF and DEA lines formed a golden cross above the zero line and continue to expand, signaling accumulating upward momentum. The 14-day Relative Strength Index (RSI) has risen to 69, approaching the traditional overbought threshold of 70, suggesting a potential short-term technical adjustment in the form of “upward resistance followed by consolidation.”
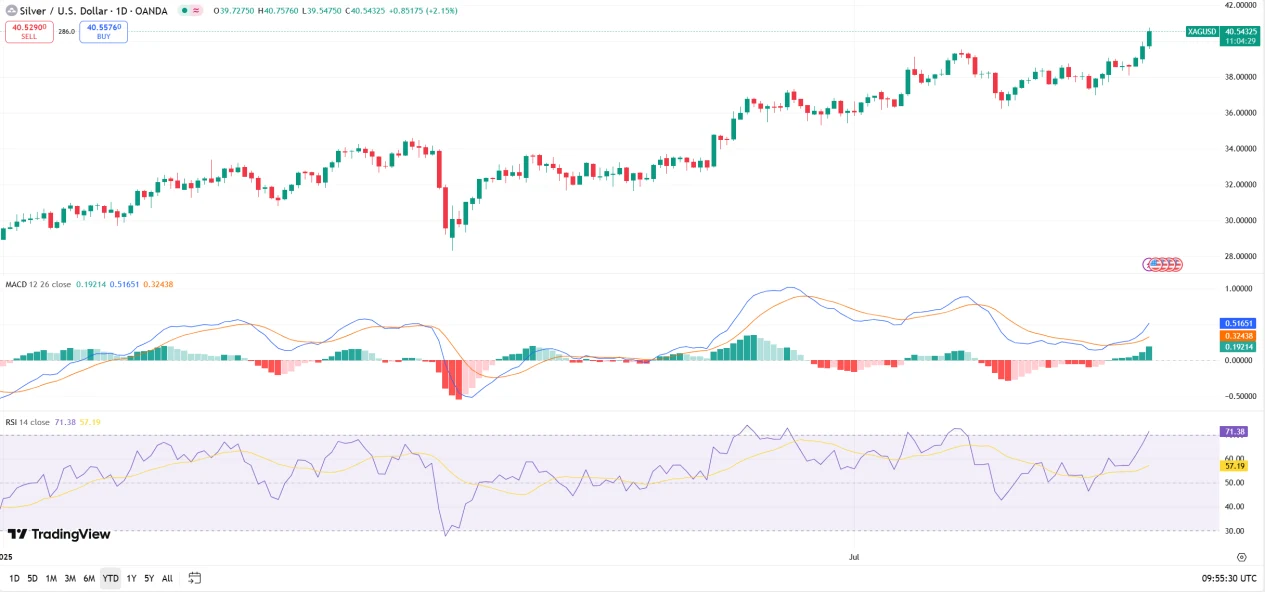
Source: TradingView
The repositioning of support and resistance levels is critical for assessing subsequent price action. In the short term, the $40 level has shifted from a prior resistance to a key support; if it holds, the next target could point toward the 2011 historical high of $48.70/oz. Downside support levels are identified at $39.70/oz (intraday low), $38.50/oz (Bollinger middle band), and $38.07/oz (previous low).
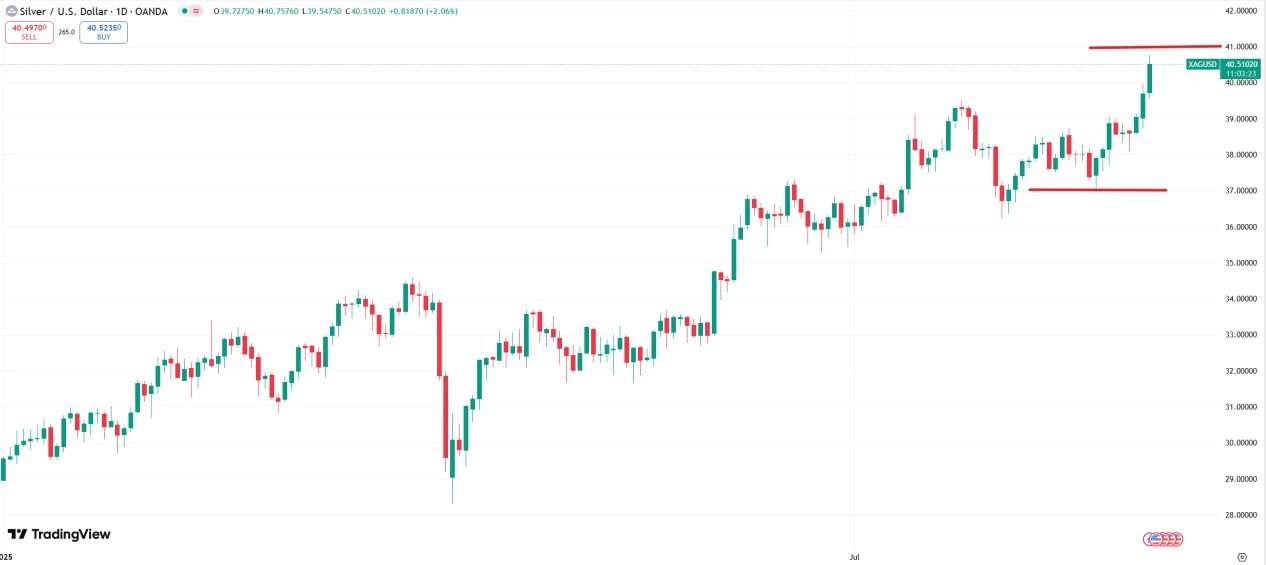
Source: TradingView
At the weekly level, the 5-week, 10-week, and 20-week moving averages display a bullish alignment, and the MACD histogram continues to expand, confirming the medium- to long-term uptrend.
Source: TradingView
The technical breakout is corroborated by market positioning. COMEX silver futures non-commercial net long positions rose 12% in August, reaching their highest level since 2020, reflecting strong bullish sentiment among institutional investors.
Looking ahead, if economic data remain weak, reinforcing expectations for Fed rate cuts, combined with persistent geopolitical risks and an ongoing silver supply-demand gap, silver prices are likely to sustain their upward trajectory. Citi analysts forecast that silver could test $46/oz by the end of Q3.
Over the long term, if global economic recovery drives industrial demand and new silver mining capacity fails to come online in a timely manner, silver could challenge the 2011 historical high of $49.51/oz. However, caution is warranted: a shift in market sentiment leading to capital outflows from precious metals, or technological breakthroughs in industries like photovoltaics reducing silver content per unit, could exert downward pressure on silver prices.
Disclaimer: The content of this article does not constitute a recommendation or investment advice for any financial products.

Email Subscription
Subscribe to our email service to receive the latest updates
