U.S. Stocks Enter Historically Weakest Month
![]() FoolBull
FoolBull
02:22 September 1, 2025 EDT
Since records began in 1928, September has consistently been the weakest-performing month for U.S. equities.
Data shows that the S&P 500 index has posted an average monthly return of –0.73% in September, with a probability of decline reaching 56%. This trend is further corroborated by Bank of America (BofA) data tracing back to 1927: the S&P 500 has averaged a decline of 1.17% in September, with the frequency of losses rising to 58% during the first year of a presidential term, accompanied by an average drop of 1.62%. Over the past decade (2015–2024), the index declined in six of those years during September, averaging a loss of 1.93%. Notably, in September 2022, the index fell 9.34% in a single month, marking one of the most significant monthly performances in recent years.
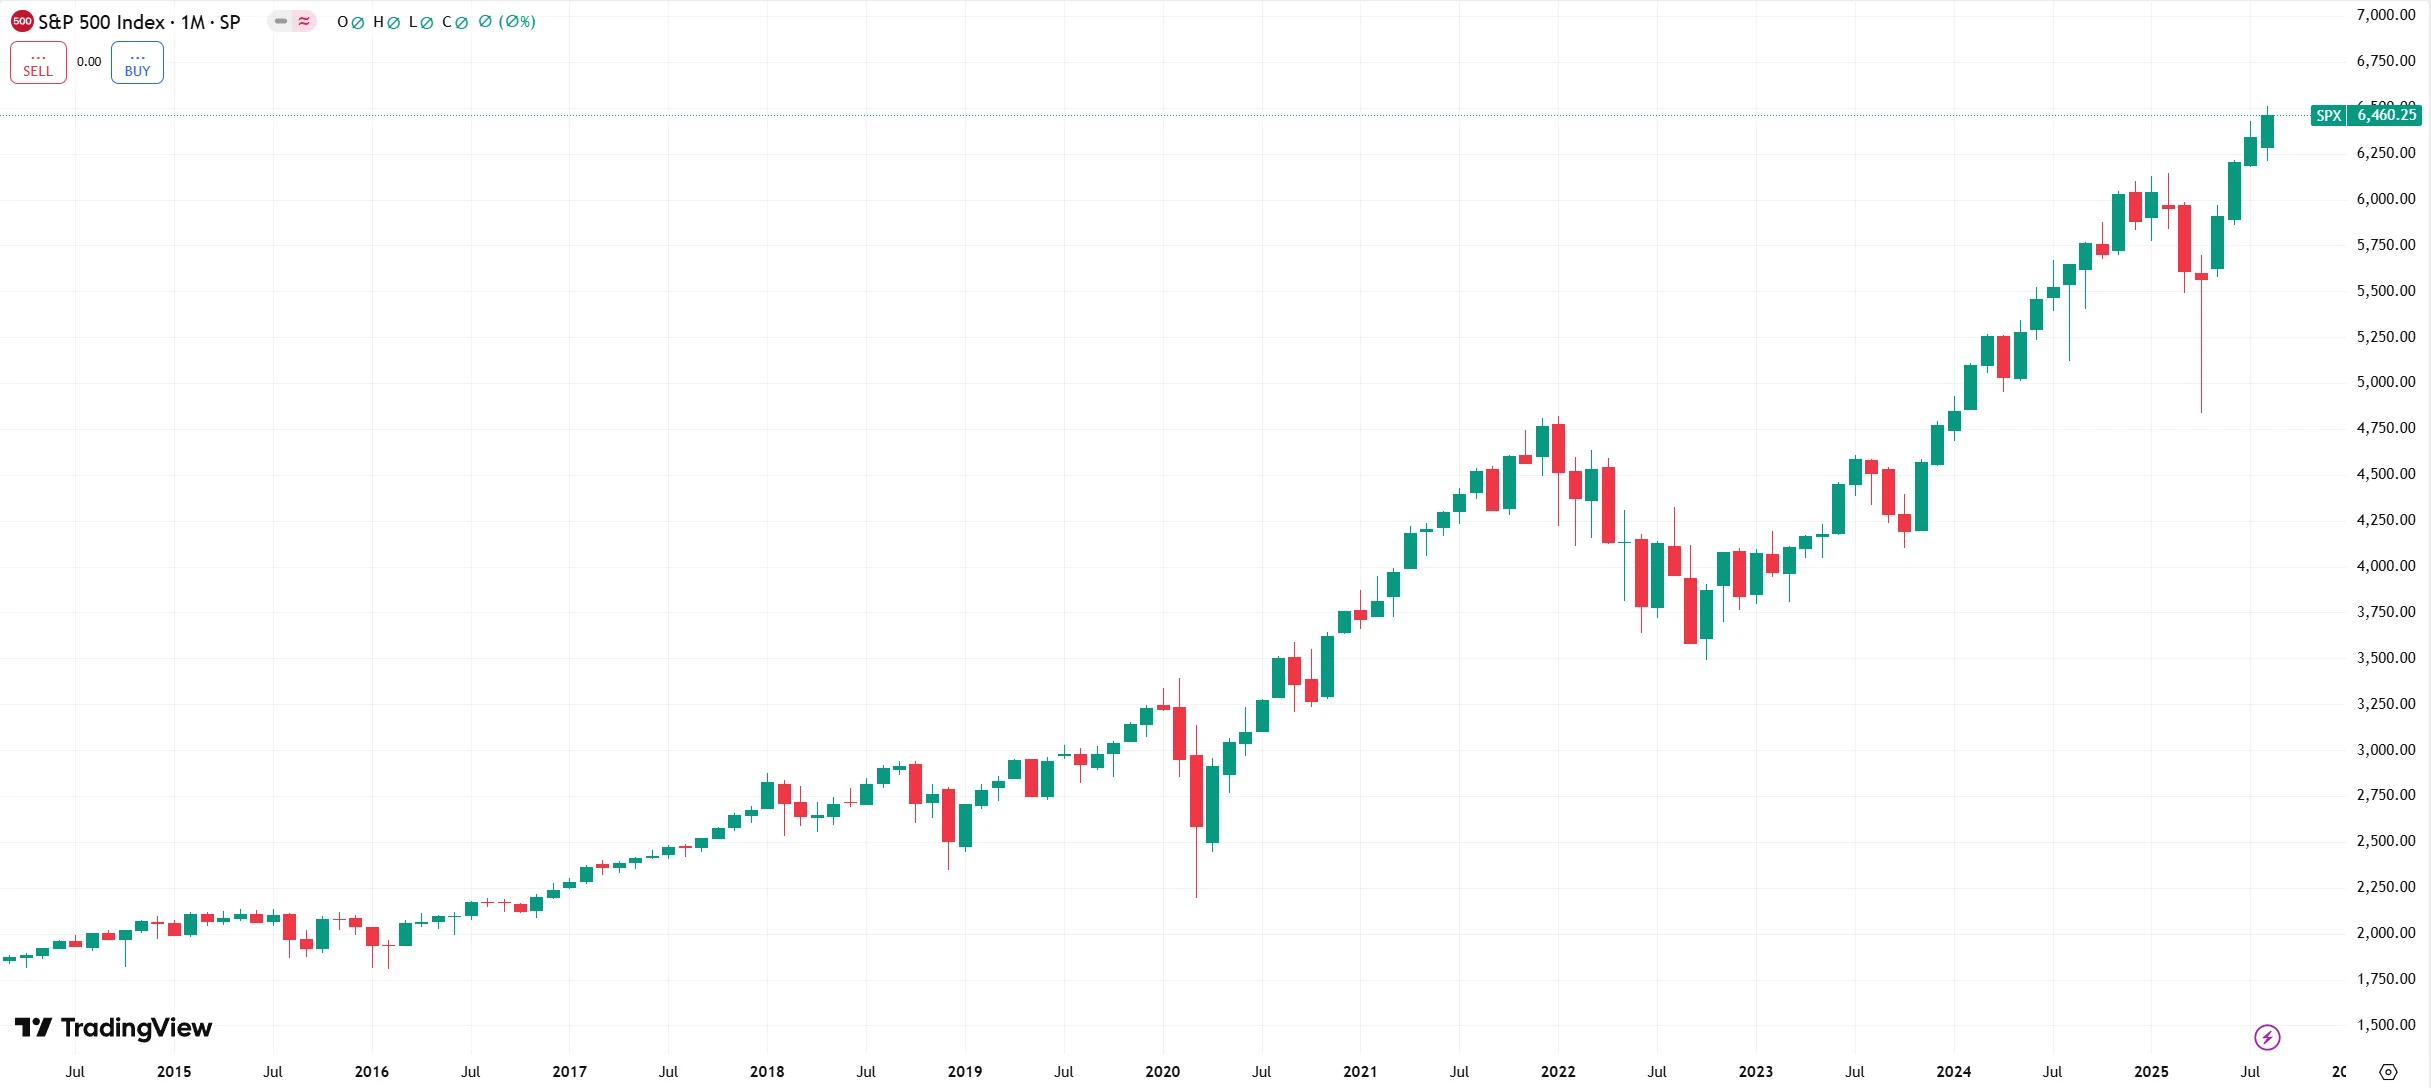
Source: TradingView
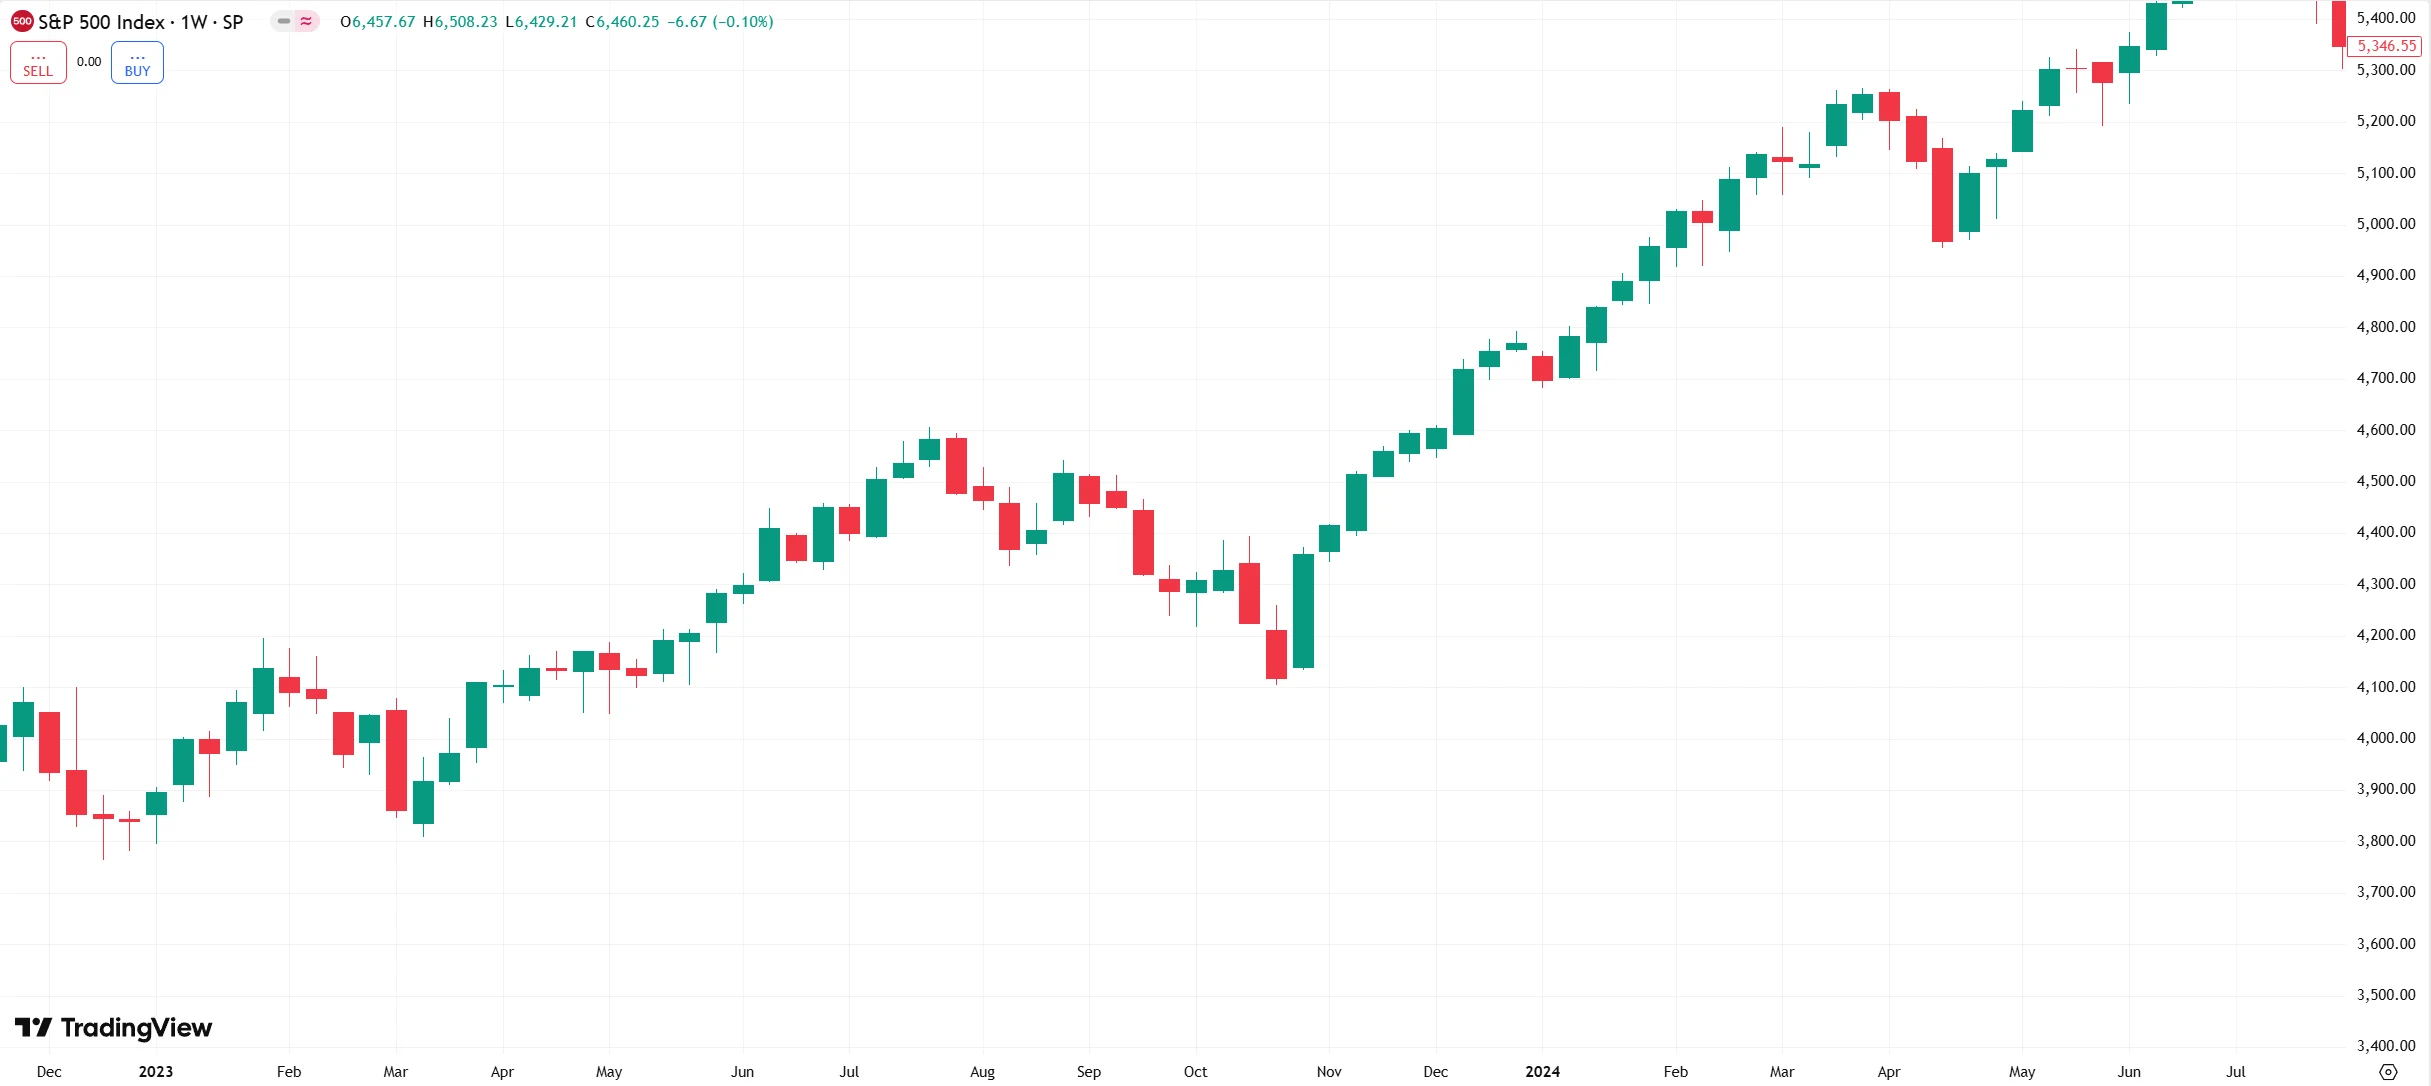
In contrast to this historical pattern, the U.S. equity market has exhibited considerable strength in 2025. As of August 28, the S&P 500 reached a record closing high of 6,501.58, climbing 30% since the April 8 low and posting a year-to-date gain of 9.8%. In August alone, the S&P 500 rose 1.9%, the Dow Jones Industrial Average advanced 3.2%, and the Nasdaq Composite gained 1.6%.
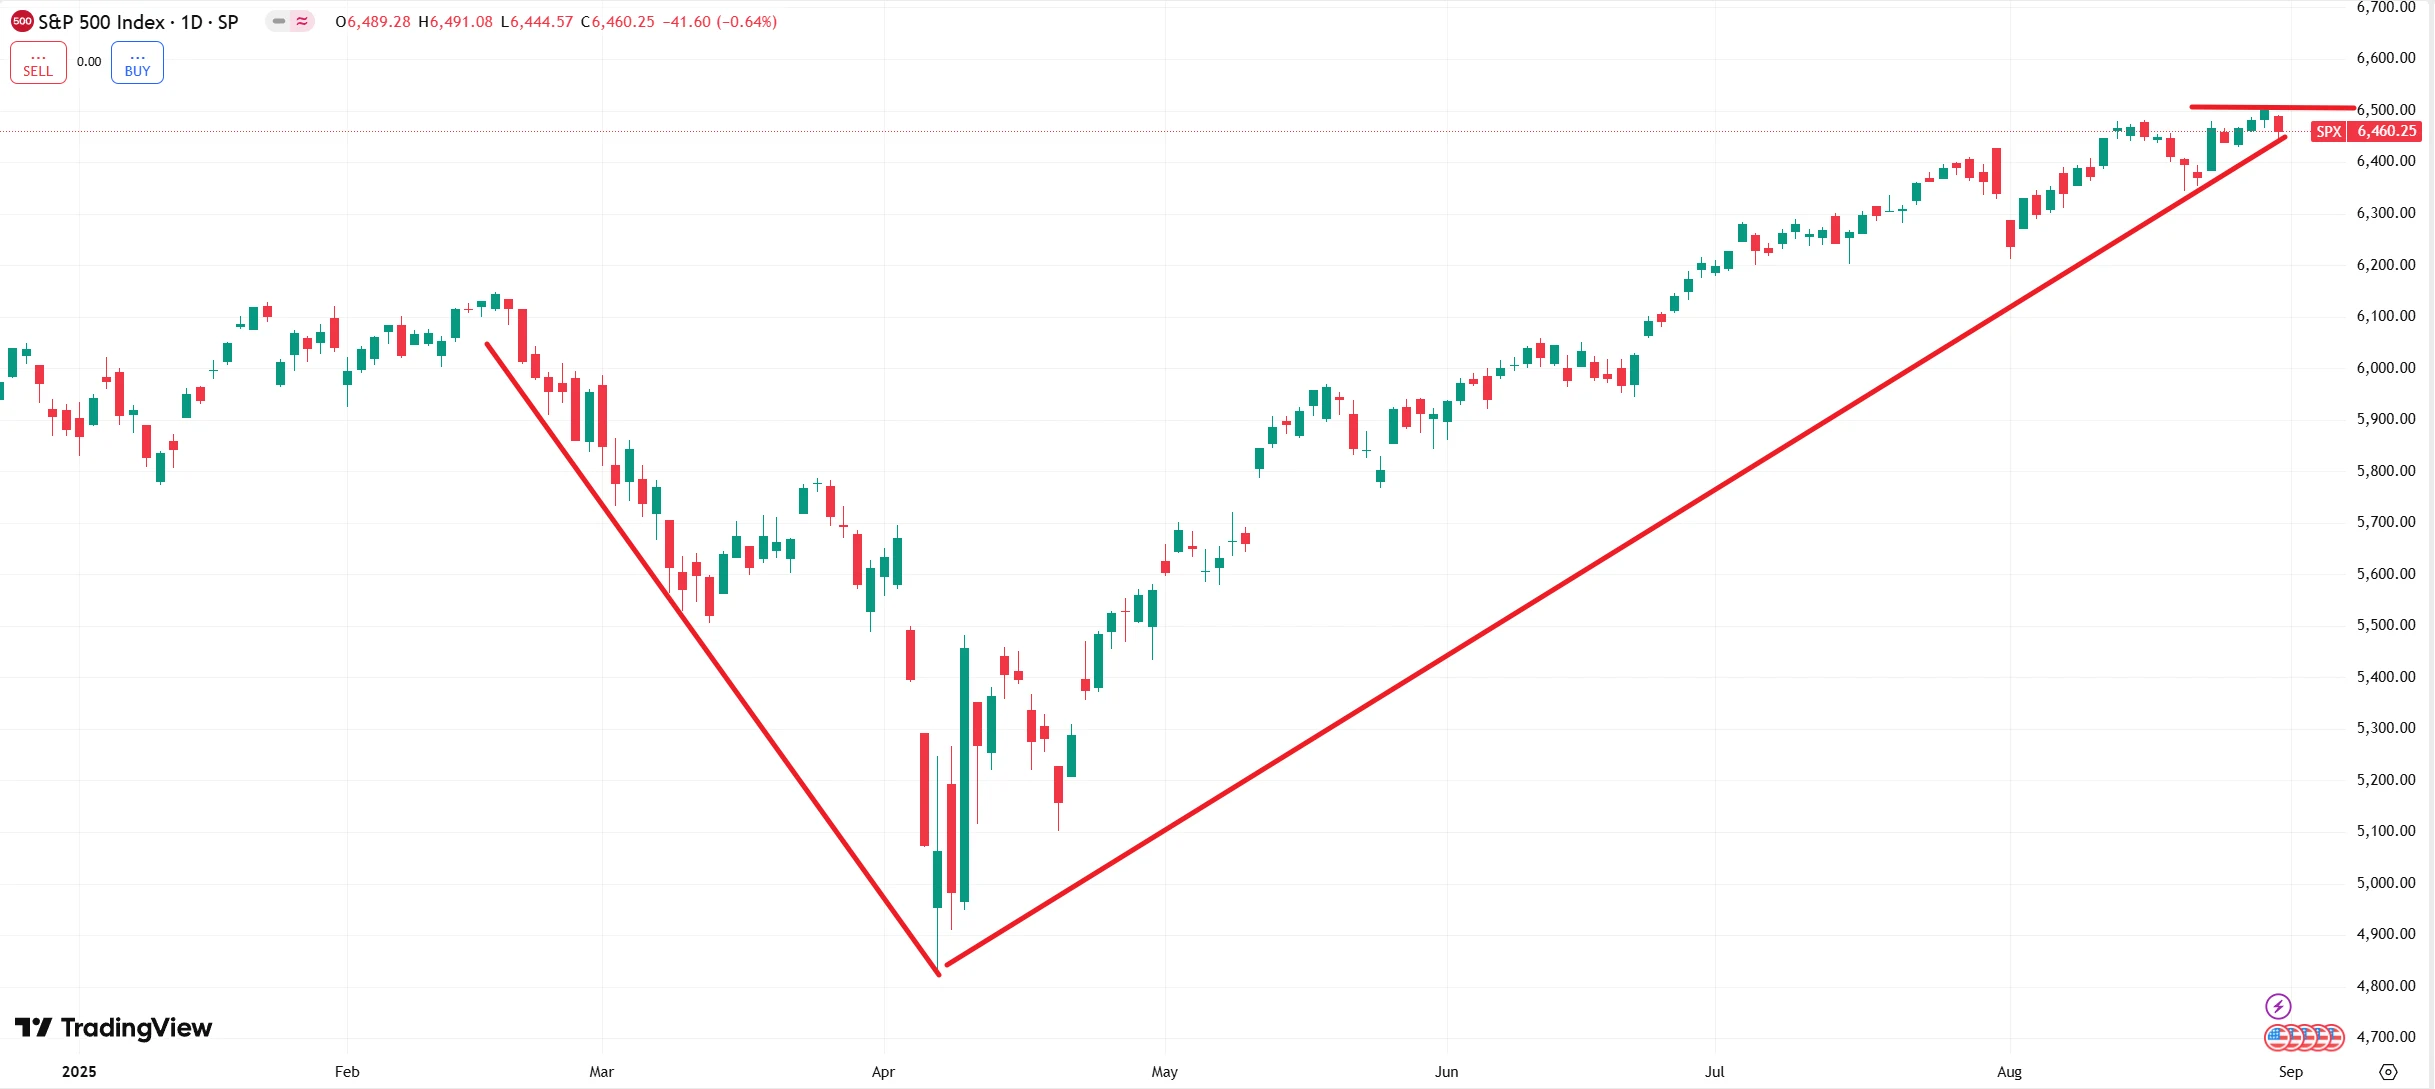
Source: TradingView
The market is currently caught between this historical seasonal weakness and recent robust performance. Economic data points and policy decisions in the coming weeks will determine whether the ongoing bull run can be sustained.
Historical Performance
Examining a longer time horizon, the S&P 500 has declined by an average of 0.7% in September over the past three decades, and recorded monthly losses in four of the past five years. Beyond the surface-level price movements, September’s market performance has often exhibited heightened sensitivity to policy shifts, with volatility significantly amplifying in years marked by changes in Federal Reserve monetary policy or adjustments in fiscal policy.
Several major market crashes throughout history have occurred in September. These events have not only reinforced investor caution during this month but also created a lasting market memory effect.
In September 1931, amid the ongoing Great Depression and exacerbated by the Dust Bowl environmental disaster, the S&P 500 plummeted 30% in a single month—still its largest monthly decline on record. This period coincided with shrinking international trade resulting from the Smoot-Hawley Tariff Act, which further intensified the economic contraction and market turmoil.
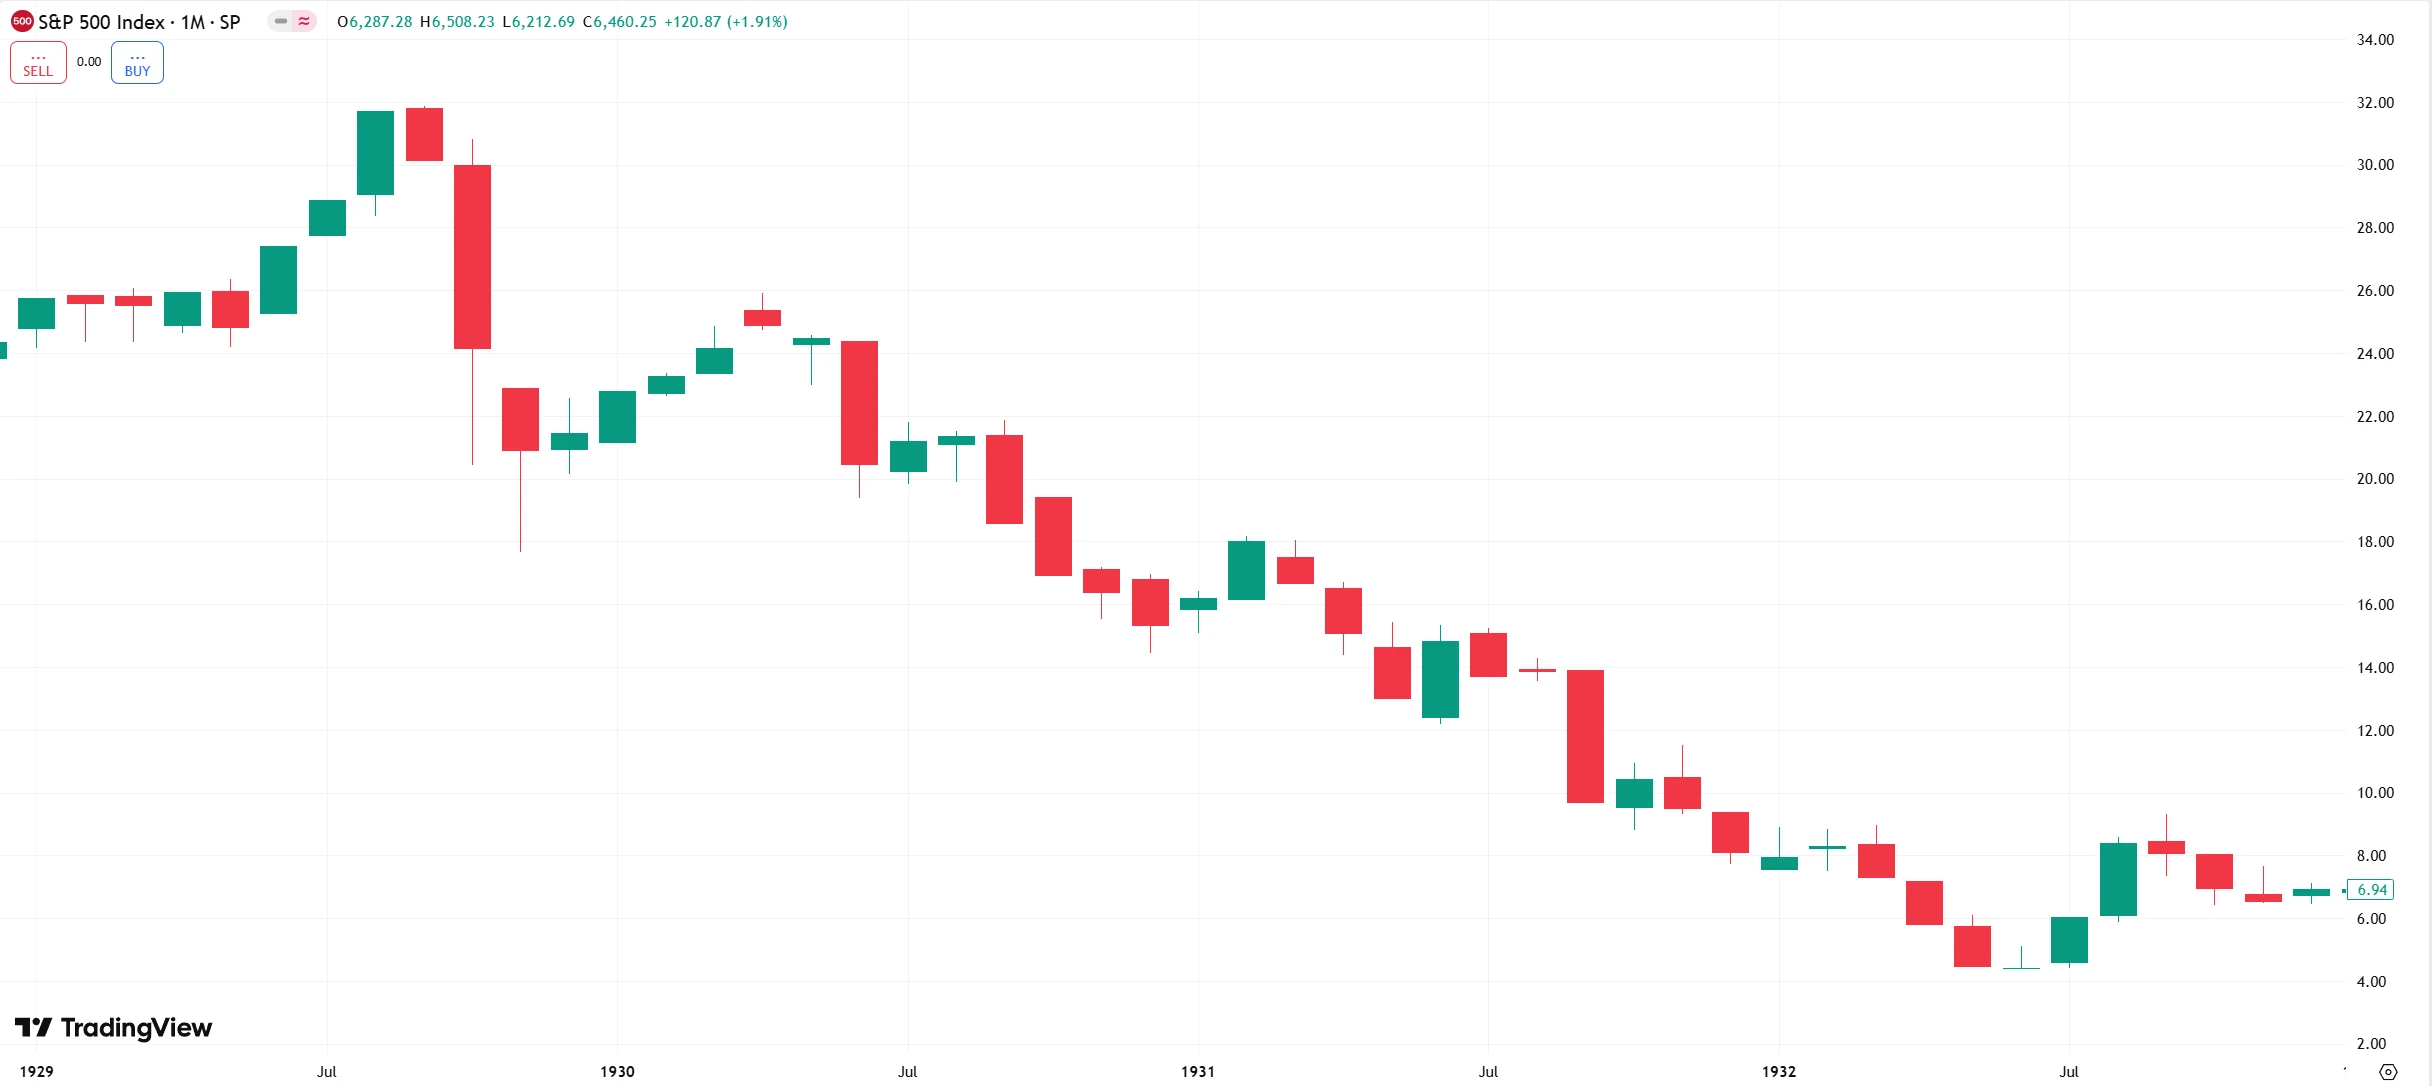
Source: TradingView
In September 1974, Richard Nixon’s resignation due to the Watergate scandal triggered a collapse in market confidence. Compounded by the lingering effects of the first oil crisis, the S&P 500 fell 12% that month. Throughout the 1973–1974 bear market, the index dropped from 118.05 points to 68.56 points, a decline of over 41%, with the September selloff serving as a key accelerant to the market bottom.
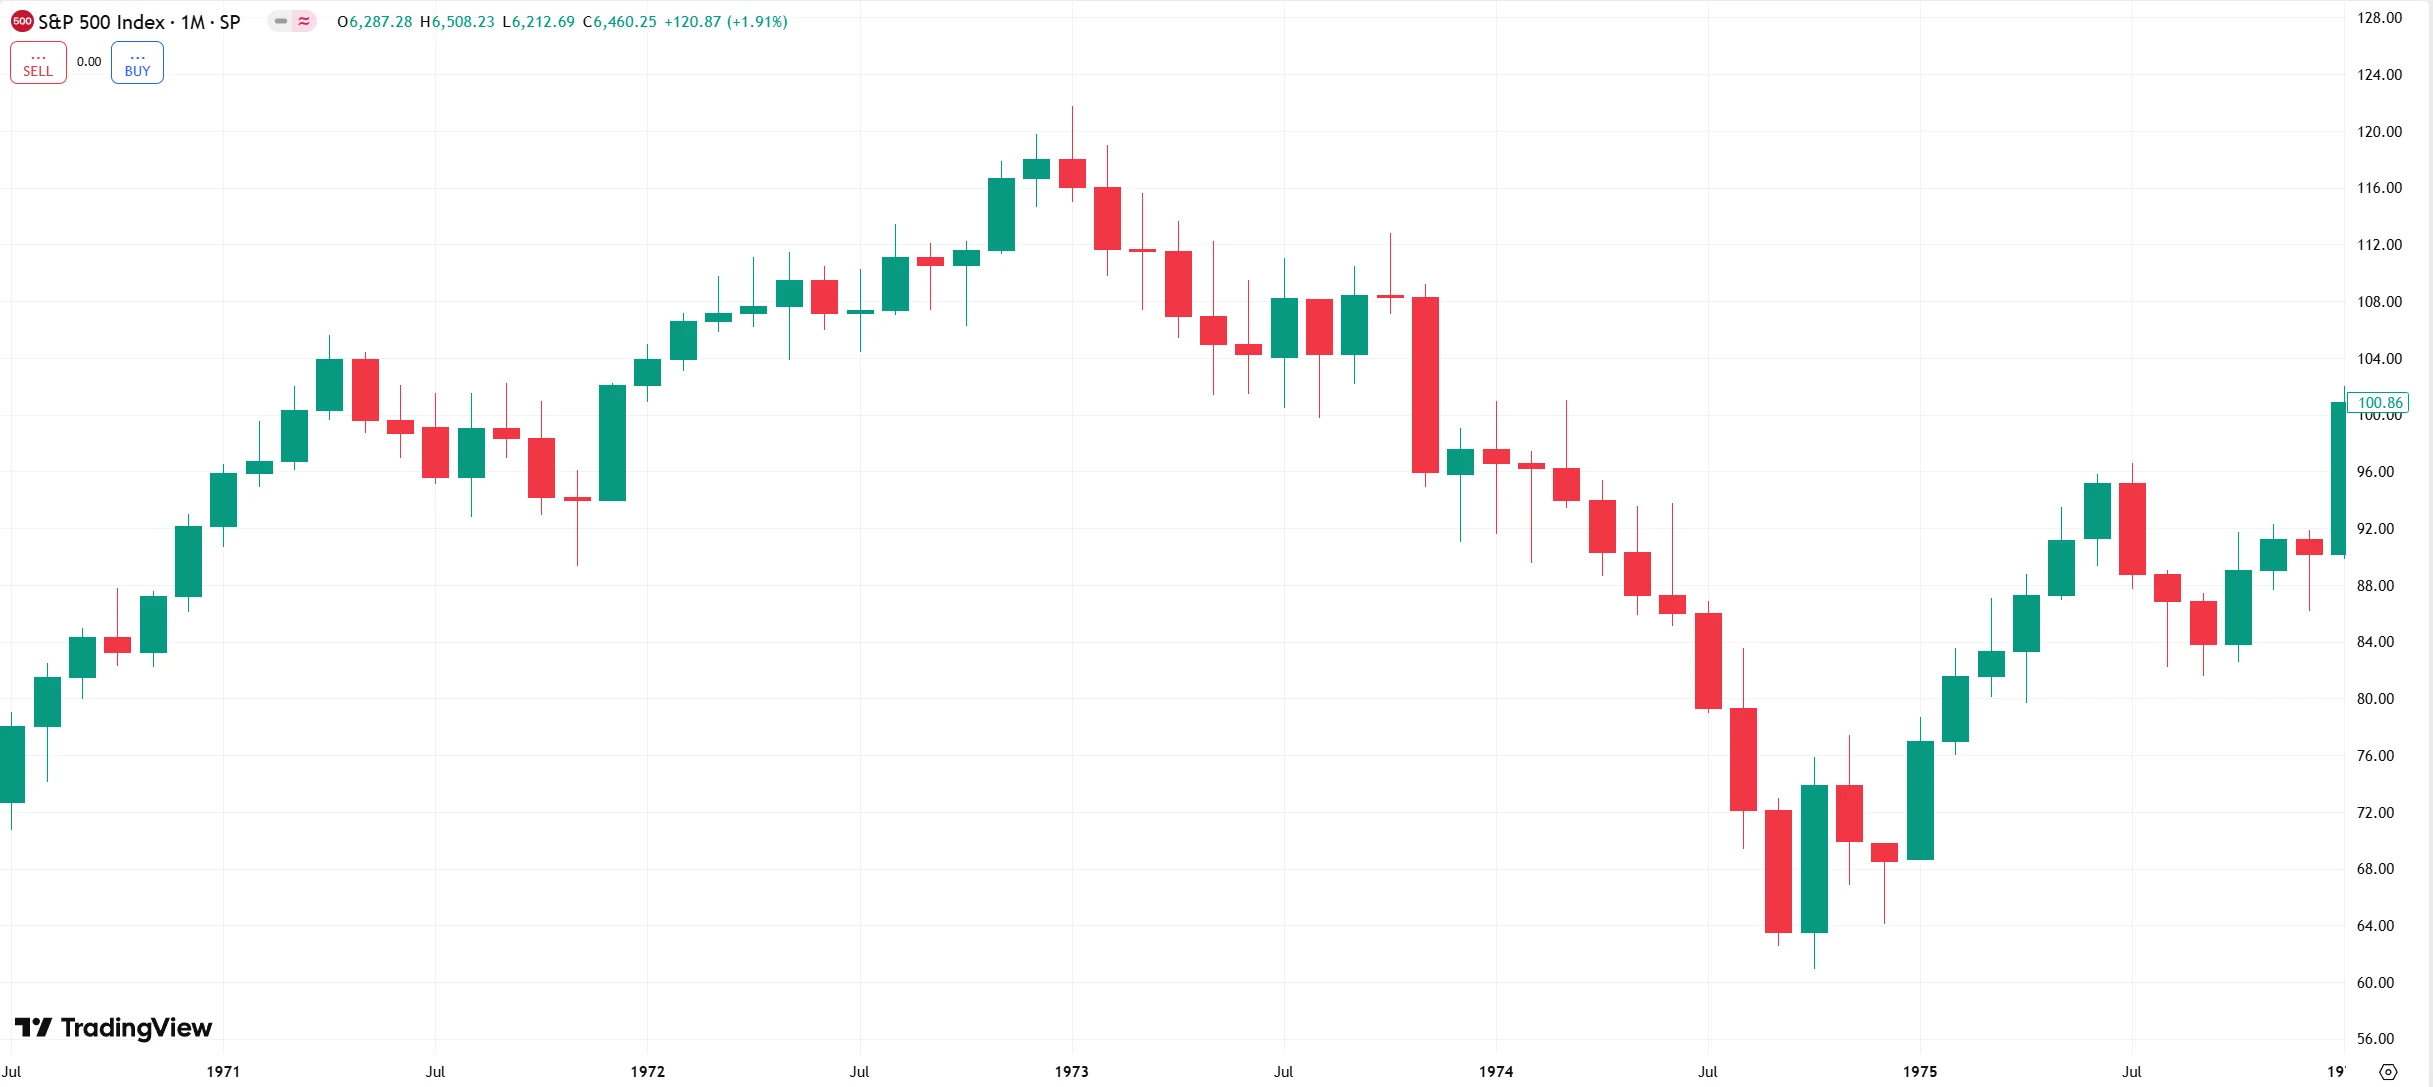
Source: TradingView
On September 15, 2008, the bankruptcy of Lehman Brothers ignited a global financial crisis. The S&P 500 fell more than 9% that month. The event underscored the systemic risks linked to balance sheet adjustments by financial institutions near fiscal year-end, a recurring feature of September.
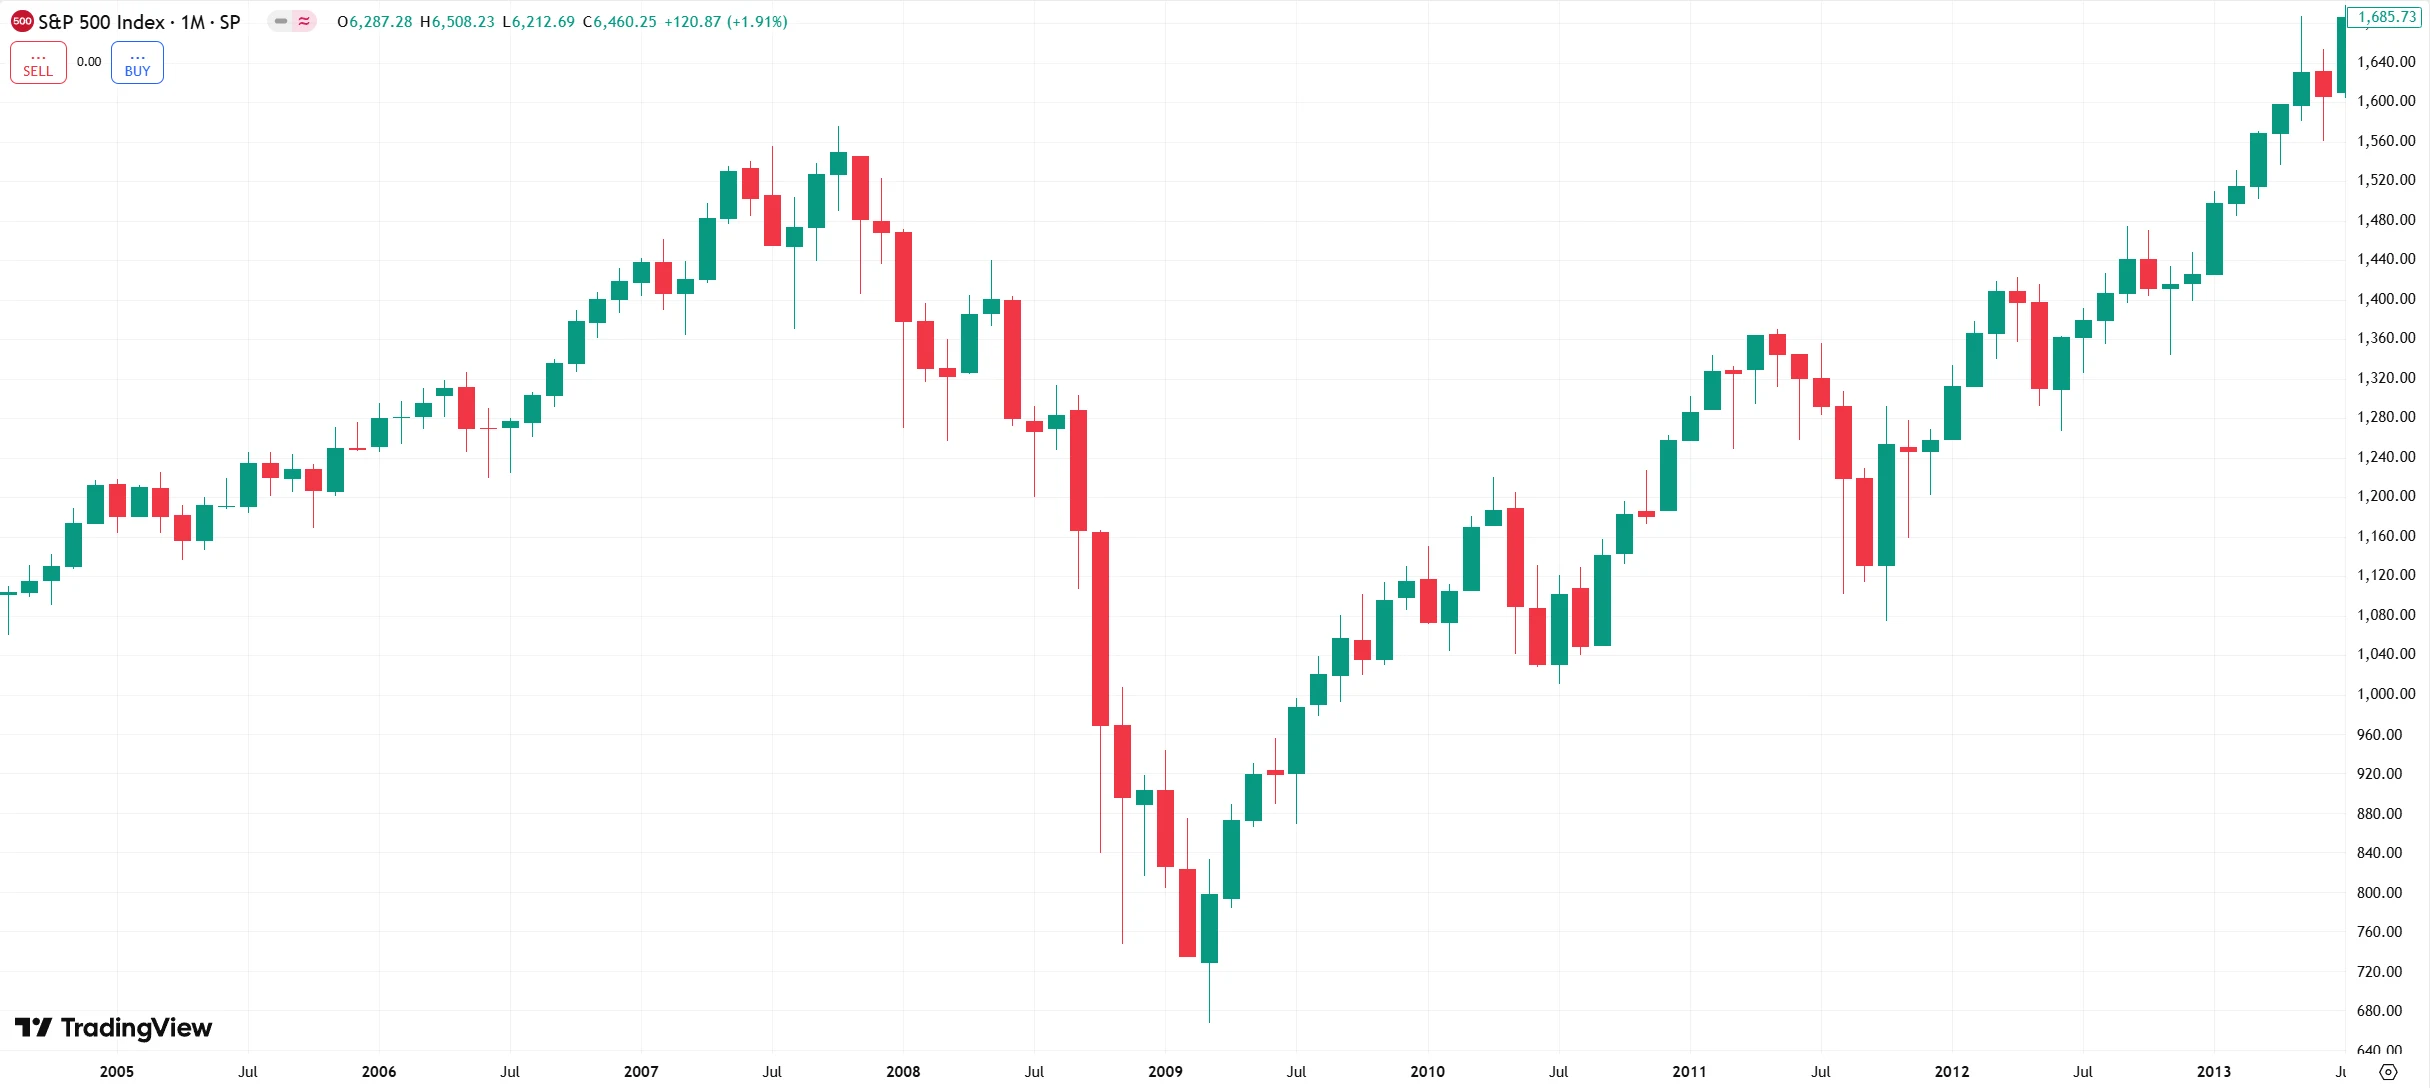
Source: TradingView
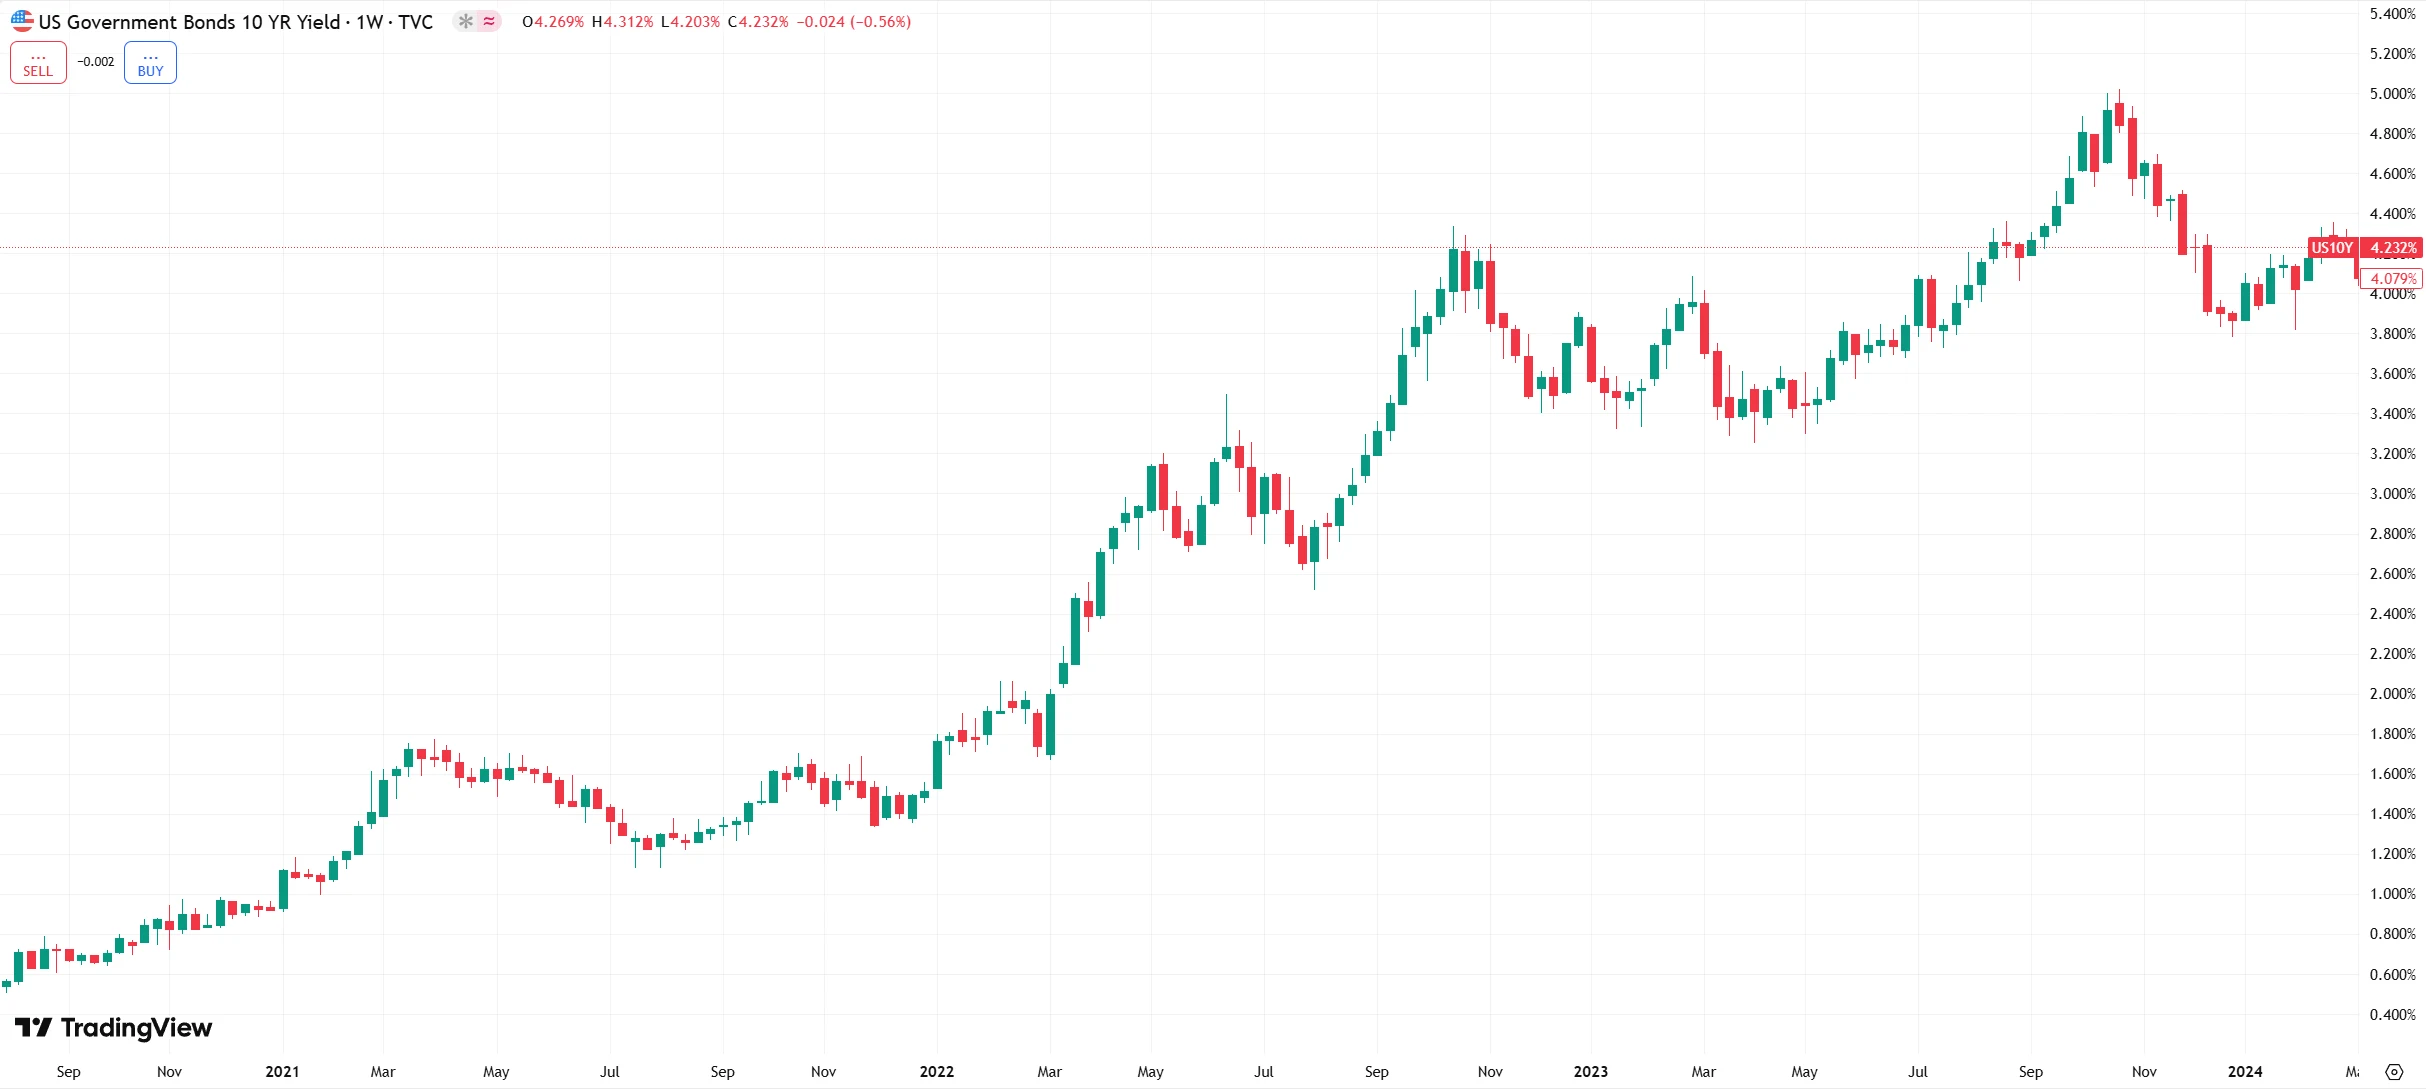
More recently, in September 2023, a large-scale debt issuance plan by the U.S. Treasury sparked a selloff in government bonds, leading to a nearly 5% decline in U.S. stocks—the largest monthly drop that year. This episode reaffirmed the continued influence of fiscal policy on September market performance.
Source: TradingView
Driving Factors
September marks the end of the U.S. fiscal year, a period when systematic fund adjustments often impact markets. Portfolio managers typically reassess their holdings during this time, selling stocks to realize gains or cut losses. These collective actions contribute to concentrated selling pressure. Additionally, Congress must finalize and pass the budget for the new fiscal year by the end of September. Political maneuvering during budget negotiations often fuels uncertainty around fiscal policy, further dampening risk appetite.
The U.S. Treasury also tends to increase debt issuance in the second half of the year to fund budget shortfalls, adding strain to market liquidity. A case in point is September 2023, when combined Treasury sell-offs by China, the UK, and Japan reached $85 billion. Weakening demand pushed Treasury yields sharply higher that month, while foreign holdings of U.S. government debt fell to a five-year low. This supply-demand imbalance transmitted directly to equity markets, intensifying downward pressure.
Source: TradingView
It is also worth noting that the summer holiday tradition in European and U.S. markets makes September a key month for capital reallocation. During holidays, traders often hedge risk with safe-haven assets like gold. Post-holiday portfolio repositioning frequently triggers short-term equity selling, reinforcing a recurring seasonal pattern that strengthens expectations for September weakness.
The psychological effect of a self-fulfilling prophecy is also evident. With poor historical returns repeatedly occurring in September, investors often adopt defensive strategies in advance. This collective caution makes markets more susceptible to declines. Citigroup data show that in 2025, hedge funds and large speculators shorted the VIX index at a pace not seen in three years, betting on continued calm—a extreme positioning that could amplify volatility in the event of a reversal.
The clustering of major negative events in September throughout history has shaped a distinct perception of risk around the month. Beyond the aforementioned crises in 1931, 1974, and 2008, the September 11 attacks in 2001 also occurred in this month. These events collectively reinforce a September-specific risk premium through market memory.
In terms of event type, major September market shocks often relate to policy shifts, geopolitical conflicts, and financial institution failures. Such events tend to be sudden and difficult to predict, making risk pricing particularly complex during the month.
In the current environment, the Trump administration’s move to hike tariffs on Indian imports to 50%, along with ongoing disputes over U.S. purchases of Russian oil, raises the potential for geopolitical flashpoints in September 2025.
Current Market Conditions
September 2025 faces an exceptionally complex backdrop. U.S. equities are entering the month after a significant rally, with the S&P 500 having surged 17% since early May. Market valuations have reached historically elevated levels—the index is trading at a forward P/E ratio of 22x, its highest since the peak of the dot-com bubble and the tech-driven exuberance following the COVID-19 low in 2020.
Over the next 14 trading sessions, the market will confront a series of key economic releases. Among them, the August nonfarm payrolls and Consumer Price Index (CPI) reports will be critical for the Federal Reserve’s policy decision on September 18. Economists project that only 75,000 jobs were added in August—marking a fourth consecutive month below the 100,000 threshold—while the unemployment rate is expected to edge higher. This would represent the weakest stretch of labor market data since 2020.
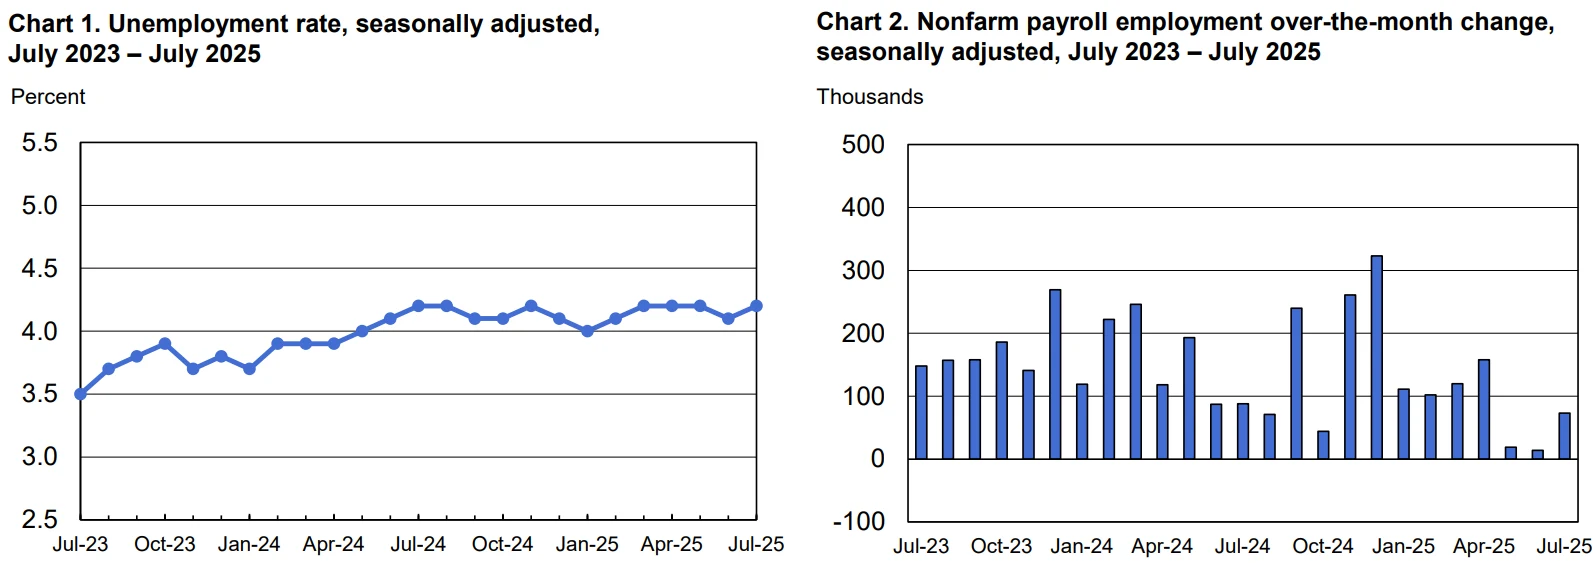
Source: U.S. Bureau of Labor Statistics
Previous July payrolls showed a gain of just 73,000 jobs, well below expectations of 110,000. In addition, figures for May and June were revised down by nearly 260,000—a 90% reduction—signaling clear cooling in the labor market that supports the case for Fed rate cuts. Goldman Sachs strategists note that Chair Powell’s emphasis on “downside risks in the labor market” at Jackson Hole has set the stage for a September cut, and a sub-100,000 print would further validate such a move.
Market-implied probability of a 25-basis-point cut in September currently stands at 87%. Swap markets are even pricing in 125 basis points of easing over the next year. Nevertheless, Bank of America maintains a hawkish stance, warning that should inflation surprise to the upside, the Fed may not cut in September or during the remainder of the year.
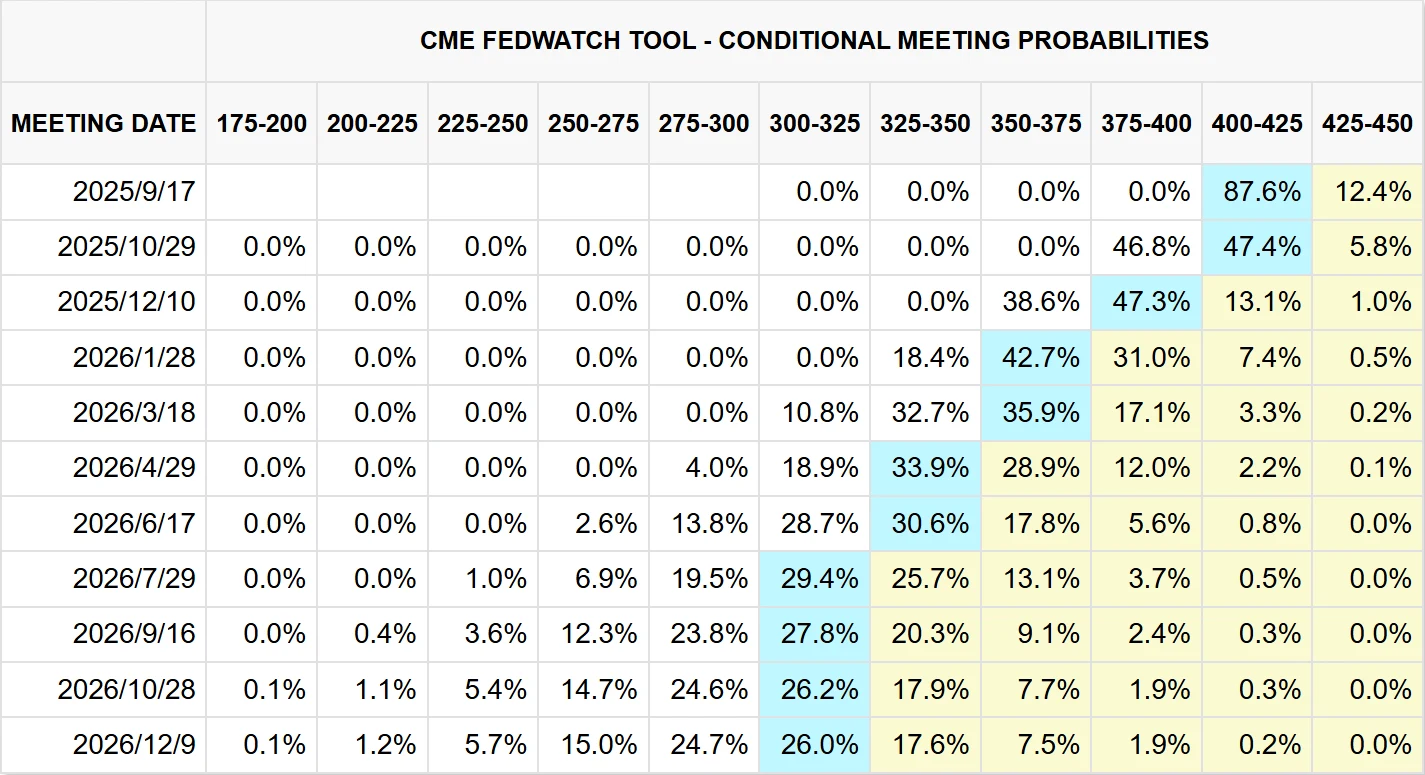
Source: CME
This divergence in expectations magnifies the potential market impact of upcoming data—any deviation from forecasts could trigger sharp volatility.
Particularly noteworthy is President Trump’s attempt to dismiss Federal Reserve Governor Lisa Cook—the first time in the Fed’s 111-year history that a sitting president has sought to remove a serving governor. Should the court rule that Cook can be dismissed, the Fed Board could be split evenly between Trump and Biden appointees, significantly raising the complexity and uncertainty around future policy decisions.
Volatility Risk
The current market is characterized by exceptional tranquility. Since late June, the VIX has closed above the 20 threshold only once, while the S&P 500 has gone 91 consecutive trading days without a 2% decline—its longest such streak since July 2024. Last Friday, the VIX climbed to just around 16, still about 19% below its one-year average. This low-volatility environment stands in stark contrast to the impending risk events.
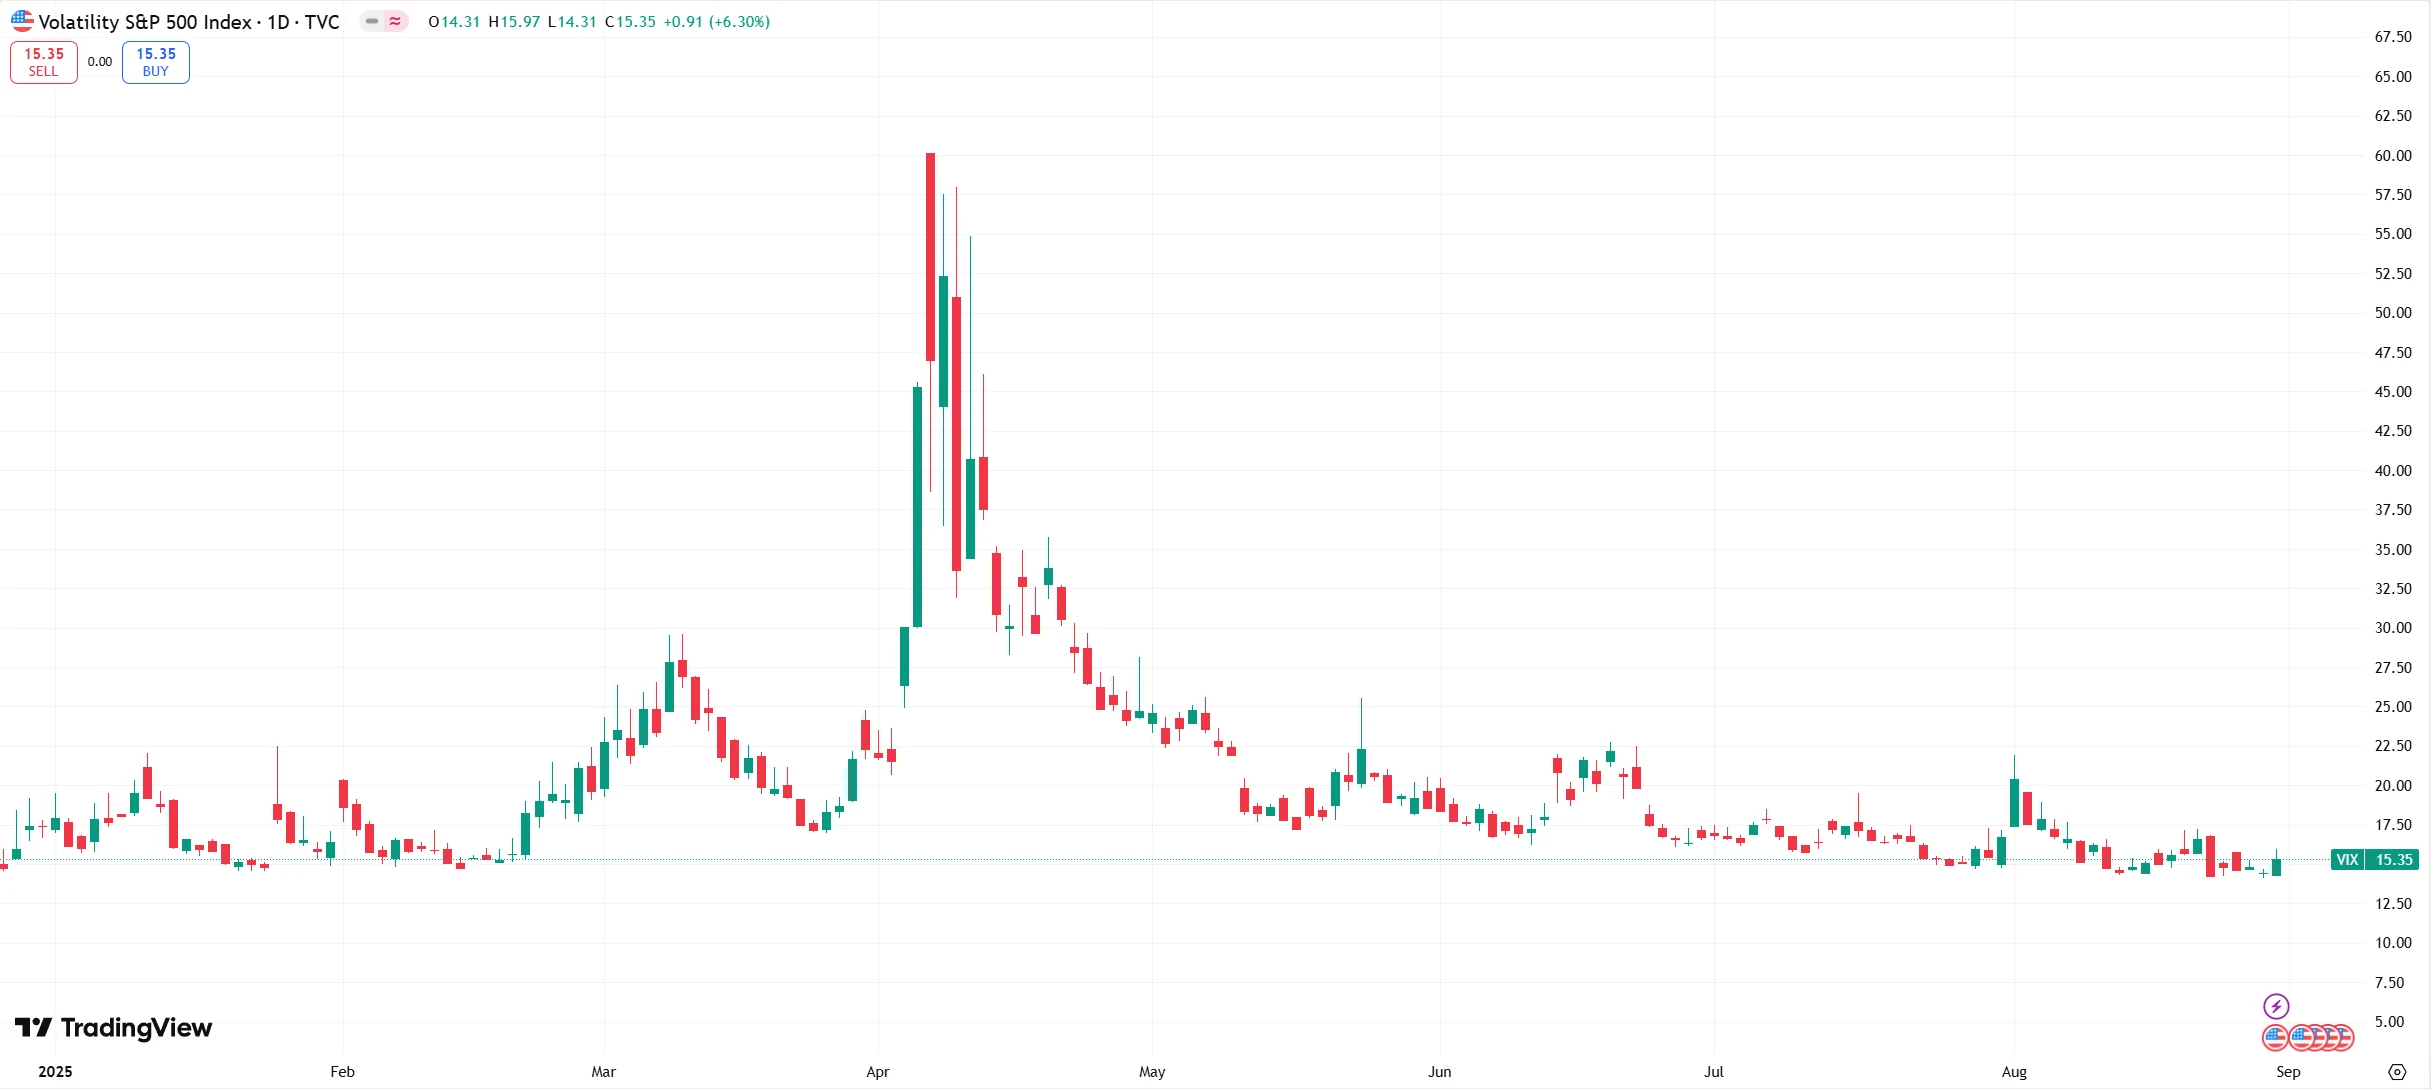
Source: TradingView
Historical experience suggests that such extreme calm often precedes a sudden surge in volatility. In February 2018, the S&P 500 peaked amid rising concerns over tariff proposals, and the VIX spiked from below 15 to around 50, causing short-volatility ETPs to lose over 90% in a single day. A similar pattern emerged in July 2024, when extreme short positioning in the VIX was followed by global market turmoil triggered by the unwinding of yen carry trades in August.
Notably, the September 18 Fed decision will be followed by a triple witching event—the simultaneous expiration of stock options, index options, and index futures. Such large-scale derivatives expirations tend to amplify market volatility. Currently, the forward implied volatility for nonfarm payroll release days is only 85 basis points, indicating that the market is under-pricing potential risks and raising the possibility of a sudden volatility spike.
In contrast to prevailing concerns, a more optimistic narrative is emerging on Wall Street. Bullish voices argue that the equity bull market will be sustained. Mark Haefele, Chief Investment Officer at UBS Global Wealth Management, stated: “The equity bull market will continue. Under our base case, we expect a soft landing, resilient corporate earnings, and lower interest rates to support the market over the next 12 months.”
A global fund manager survey conducted by Bank of America from July 31 to August 7, 2025, showed that investor optimism rose to its highest level since February, with cash allocations falling to a record low of 3.9%.
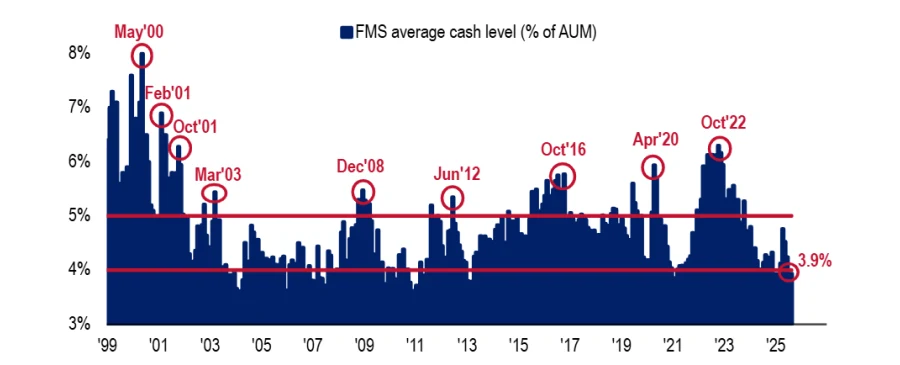
Source: BofA Global Fund Manager Survey
Furthermore, a survey taken between July 3 and 10 also showed the largest increase in allocations to U.S. stocks since December, with risk appetite posting its fastest three-month rise since 2001.
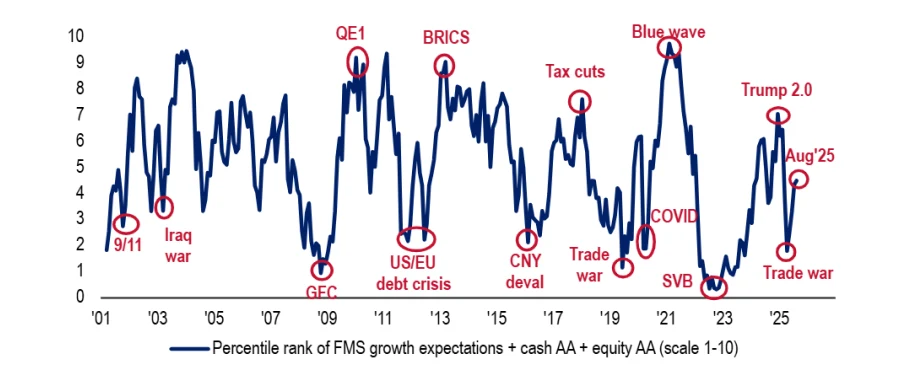
Source: BofA Global Fund Manager Survey
Potential Outcomes
Based on different combinations of key macroeconomic and corporate variables, the market may follow three distinct paths in September.
Under the baseline scenario, if nonfarm payroll growth remains in the range of 70,000–80,000 with inflation moderating year-on-year and the Fed proceeds with a widely expected 25-basis-point rate cut, the market will likely experience “initial weakness followed by a rebound.” The S&P 500 could see swings of 1–3% around data releases, though net movement by month-end is expected to stay within ±2%. Should Broadcom’s earnings—scheduled after Nvidia’s—meet expectations, the tech sector will likely remain relatively resilient, providing support to the broader market.
In the risk scenario, a unexpectedly strong jobs report (over 100,000 new positions) coupled with hotter-than-expected CPI data could force the Fed to delay cutting rates. Such an outcome would significantly dampen risk appetite, potentially causing the S&P 500 to replay a sharp correction reminiscent of 2022, with a monthly decline exceeding 5%. High-valuation technology stocks would be particularly vulnerable.
Under the optimistic scenario—seen as less likely—a pronounced slowdown in job growth alongside markedly cooler inflation could prompt the Fed to implement a 50-basis-point cut. This could propel the S&P 500 to break to new all-time highs, thereby breaking the pattern of traditional seasonal weakness in September.
Final Thoughts
September’s status as the historically weakest month for U.S. stocks stems from the long-term convergence of institutional arrangements, behavioral patterns, and event-driven shocks. From the Great Depression in 1931 to the financial crisis in 2008, historical events have continually reinforced the market’s perception of September risks. In September 2025, markets face an even more complex environment, influenced both by structural factors such as the Federal Reserve’s policy pivot and adjustments in the AI industry, as well as short-term variables including geopolitics and derivatives expirations.

The tension between the current market strength and historical seasonal patterns reflects investor optimism toward a economic soft landing and technology-led growth. However, the unusually subdued VIX and extreme positioning suggest underlying volatility risks. Economic data releases and policy decisions over the next two weeks will serve as critical inflection points—potentially determining whether the ongoing rally can withstand September’s seasonal headwinds.
Disclaimer: The content of this article does not constitute a recommendation or investment advice for any financial products.

Email Subscription
Subscribe to our email service to receive the latest updates
