Five-Day Losing Streak for the S&P 500: What to Watch for Support and Recovery Signals
![]() FoolBull
FoolBull
03:19 August 22, 2025 EDT
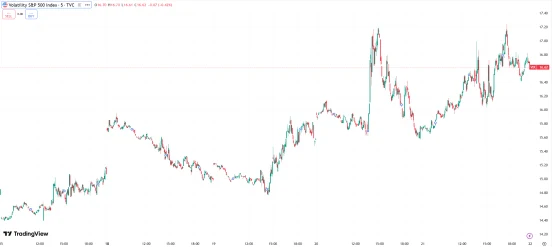
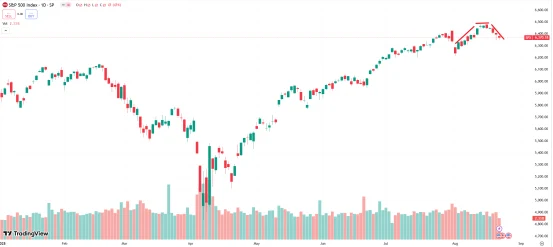
Between August 15 and August 21, 2025, the S&P 500 Index closed lower for five consecutive trading sessions, marking its longest losing streak since early January 2025. The index fell from 6,449.38 at the close on August 15 to 6,370.17 at the close on August 21, a cumulative decline of about 1.23%. This pullback interrupted the summer rally seen in early August, when the index notched multiple record highs.

Source: TradingView
Investors remained cautious ahead of Federal Reserve Chair Jerome Powell’s speech at Jackson Hole on August 22, with markets watching closely for signals on the future path of interest rates. After five straight losses, the S&P 500 is testing key support levels while also showing potential signs of a rebound.
During the same period, the Dow Jones Industrial Average and the Nasdaq Composite fell 1.1% and 1.5%, respectively. The downturn comes as Powell prepares to deliver a pivotal address at the Jackson Hole Economic Policy Symposium, with uncertainty over monetary policy reaching a temporary peak.
Market Characteristics
It’s worth noting that the S&P 500’s recent five-day slide was not a panic-driven selloff but rather a moderate pullback dominated by “short-term consolidation and policy caution,” providing useful reference points for identifying support levels and rebound signals.
First, from the perspective of index performance and trading volume, daily declines in the S&P 500 over the five sessions ranged between 0.4% and 0.6%, with no single-day drop exceeding 1%. Average daily trading volume fell to 38.2 million shares, roughly 18% below the June average, indicating that selling pressure has not been concentrated and that investors remain reluctant to sell. On August 21, the index touched an intraday low of 6,352.71 before edging higher, showing initial signs of short-term support.
Looking at sector and capital flows, the market showed orderly rotation rather than broad-based flight. Defensive sectors held up well, with energy and utilities posting gains against the trend, while high-valuation information technology and consumer discretionary sectors led the decline. According to LSEG data, the S&P 500 Value Index fell only 0.5% during the period, outperforming the Growth Index. This “flight to value” provides additional evidence of capital support at key levels.
Market sentiment indicators also suggest caution rather than fear. The VIX volatility index rose from 15.2 on August 15 to 16.6, still well below the “fear threshold” of 20. Meanwhile, the S&P 500 put/call ratio fluctuated between 0.85 and 1.15, without breaching the bearish extreme of 1.0, leaving room for a rebound in sentiment. Should policy expectations or economic data show marginal improvement, capital could quickly rotate back into growth sectors.
Source: TradingView
Reasons for the Decline
What has been driving this latest pullback in the market? Looking across three major dimensions—policy, valuation, and earnings—several core factors emerge:
Federal Reserve policy expectations: shifting from “certain rate cuts” to “conditional wait-and-see”
The sharp repricing of expectations for a September rate cut has been the primary trigger for the S&P 500’s losing streak.
Following the release of early-August nonfarm payroll data, the CME FedWatch tool showed a 90% probability of a 25-basis-point cut in September. By August 22, however, that probability had dropped to 73%, reflecting mixed policy and economic signals that altered market expectations.
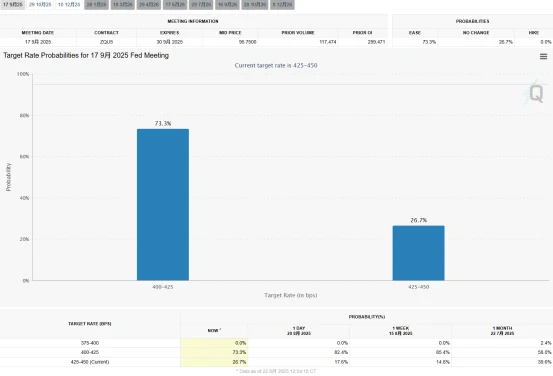
Source: CME
August data reinforced the perception of “economic resilience.” The preliminary August Markit Manufacturing PMI came in at 53.3—its highest since May 2022—beating forecasts of 49.7 and up from 49.8 previously. Manufacturing output and backlogs both climbed to mid-2022 highs, new orders reached their strongest level since February 2024, and hiring accelerated at the fastest pace since March 2022.
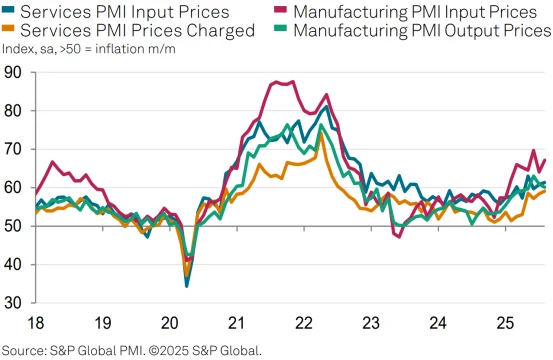
Source: S&P Global
Meanwhile, July existing home sales rose at an annualized pace of 4.01 million units, up 2.0% month-on-month, breaking a three-month losing streak. Core PCE inflation for June still ran at 2.8% year-on-year, above the Fed’s 2% target. Combined with tariff-related supply chain risks, these factors reinforced the Fed’s “wait-and-see” camp. The July FOMC minutes, which stressed the need for “more evidence of cooling inflation,” were also viewed as a direct signal of the current policy stance.

Source: BEA
Tech valuations: pressure to correct at elevated levels
Against shifting policy expectations, richly valued sectors have borne the brunt of selling pressure. Since bottoming in April 2025, S&P 500 tech stocks have surged roughly 42%, far outpacing the broader market—but valuations have pushed into historically high territory, creating clear downside pressure.

Source: TradingView
As of August 21, the sector’s Shiller P/E stood at about 37, placing it in the 95th percentile since 1980 and well above its historical average of 22.3. AI-linked names such as Nvidia and Palantir trade at forward P/E multiples above 50x, versus a sector average around 32x.
Skepticism has grown. OpenAI CEO Sam Altman remarked on August 20 that “some AI-related stocks are disconnected from earnings fundamentals,” while an MIT report on AI investment returns noted that “only 15% of tech companies have seen revenue growth from AI investments.” These warnings prompted profit-taking in high-valuation names. Nvidia and Tesla collectively lost more than $120 billion in market cap this week, and the Philadelphia Semiconductor Index fell 2.6%, accelerating valuation pressure.
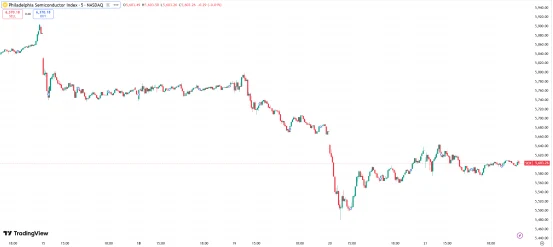
Source: TradingView
Corporate earnings: consumer weakness and downward tech revisions
Beyond valuation, earnings divergence has been a key driver of volatility. Consumer stocks have disappointed: aside from Walmart, big-box peers such as Target (Q2 same-store sales -1.9%) and Home Depot (flat net income year-over-year) have issued profit warnings, highlighting continued softness in price-sensitive demand. July U.S. retail sales rose just 0.5% month-over-month, confirming pressure on household spending.
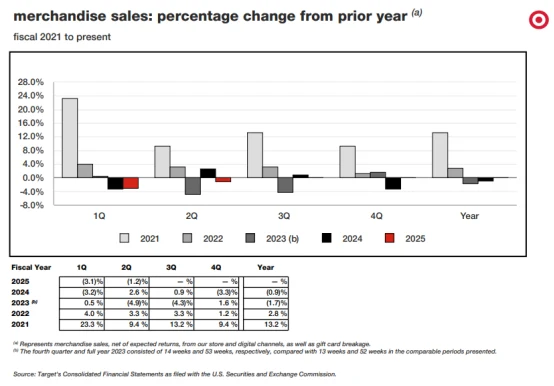
Source: Target
At the same time, tech earnings forecasts have been trimmed. Goldman Sachs noted in late August that roughly 15% of mid-cap tech firms have seen Q3 2025 earnings estimates revised down by 3%–5% as AI capex payback periods lengthen. Microsoft and Google both signaled in Q2 that AI-related capital expenditures will persist into 2026, raising market concerns about near-term profitability.
External risks: tariffs and regulatory uncertainty
Layered onto shifting policy expectations and valuation corrections, external risks have further weighed on risk appetite.
On August 18, the U.S. Commerce Department proposed reallocating $2 billion in CHIPS Act funding from semiconductor manufacturing to critical mineral projects and floated taking equity stakes in firms such as Intel and Micron. The move sparked concerns over policy consistency, driving semiconductor stocks down 1.9% on the day.
Regulatory pressure has also intensified. On August 20, the National Highway Traffic Safety Administration (NHTSA) opened an investigation into Tesla over delays in reporting Autopilot-related crashes, covering 12 incidents since 2024. That same day, the Federal Trade Commission (FTC) launched an antitrust probe into Meta’s VR hardware market, adding another policy overhang for tech stocks.
Technical Analysis
Building on these factors, technical indicators confirm the market’s near-term weakness. After five consecutive declines, the S&P 500 has lost upward momentum, retreating from its August 15 peak of 6,450 to form a “descending flag” consolidation pattern. Trading volume has gradually thinned during the pullback, suggesting that selling pressure has not yet been fully exhausted.
Source: TradingView
Key technical levels: 6,376 (20-day moving average) serves as immediate support. A decisive break below this level could open the way to 6,252 (50-day moving average).
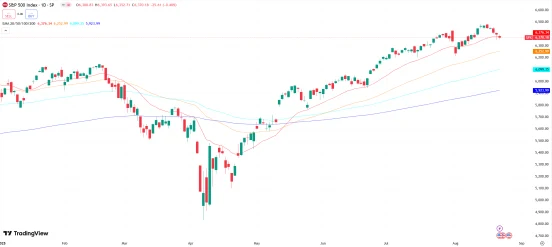
Source: TradingView
It is also worth noting that the “death cross” that formed on April 15—when the 50-day moving average fell below the 200-day moving average—continues to weigh on the medium-term trend. Historical data show that over the past 50 years, the S&P 500 has experienced 24 such death crosses; according to LSEG, in 46% of these cases the index went on to decline an average of 19% following the signal.
The Relative Strength Index (RSI) has stayed in the neutral-to-weak 45–50 range for three straight sessions, while the stochastic oscillator (KDJ) shows a bearish alignment. However, oversold signals have been muted by ongoing policy uncertainty.
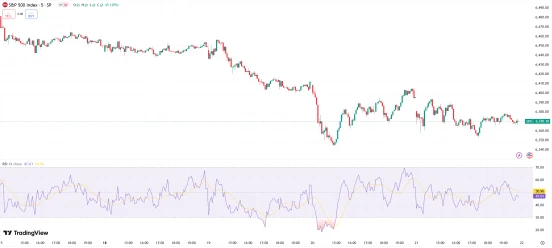
Source: TradingView
Caution flag: Open interest in S&P 500 futures has risen 12% during the decline, indicating a buildup of speculative short positions. Meanwhile, the VIX volatility index has climbed from a low of 14.4 to as high as 17.2, signaling a notable uptick in risk aversion.
Key Points
Global attention is now firmly on the Jackson Hole Economic Policy Symposium, where Federal Reserve Chair Jerome Powell is set to deliver his keynote address on August 22. Traders will be parsing every word for clues on a possible rate cut in September. While expectations for a September cut were once high, those odds are now under pressure as investors reassess the risks.
Markets are focused on several key signals Powell’s speech might deliver. First, policy framework adjustments remain front and center: if Powell hints at abandoning “average inflation targeting” in favor of a strict 2% inflation anchor, U.S. Treasury yields could jump by 10–15 basis points, challenging the market’s dovish assumptions.
Second, tariffs and inflation: the Fed’s view on how tariffs might feed through to core inflation will directly shape the pace of rate cuts. If Powell acknowledges that “tariffs could raise inflation by 0.5–1 percentage point,” the probability of a September cut could fall below 60%.
Third, employment priorities: if Powell stresses that “inflation risks remain paramount,” rather than continuing the 2024 “employment-first” stance, markets may interpret this as a more hawkish bias—potentially intensifying selling pressure.
If the S&P 500 falls below the critical 6,350 support level during Powell’s speech, it could trigger algorithmic stop-loss selling, pushing the index toward 6,200. According to BTIG estimates, significant options-hedging demand lies below that level, which could amplify volatility. Conversely, a dovish signal could lift the index back toward 6,450.

Source: TradingView
Sector implications:
Technology stocks could see their pullback turn into a broader structural adjustment, as high-valuation segments like semiconductors and AI names need to digest premiums of 30% or more.
Energy stocks may serve as a haven, supported by geopolitical risk premiums and a cyclical inventory rebound.
Consumer stocks remain under pressure from weak retail data and corporate profit warnings, limiting near-term upside.
Historical context: Last year, Powell’s Jackson Hole speech was interpreted as dovish. U.S. Treasury yields and the dollar index fell sharply, while all three major equity indexes opened higher and extended gains during his remarks.
At that time, Powell stated explicitly that “the time for policy adjustment has arrived,” expressing greater confidence that inflation was moving sustainably toward the 2% target and signaling that the Fed did not wish to see significant cooling in the labor market. He appeared to prioritize employment over inflation, saying inflation was already “very close to target” and confidence had increased in its return to 2%.
Following his speech, the 10-year Treasury yield fell from 3.85% to 3.79% before closing at 3.80%, while the dollar index dropped below 101. Major equity indexes ended modestly higher, with the Nasdaq, S&P 500, and Dow Jones all posting small gains.
But 2025 is different. Unlike last year, tariff-related inflation risks loom larger, likely prompting Powell to adopt a more cautious tone.
Disclaimer: The content of this article does not constitute a recommendation or investment advice for any financial products.

Email Subscription
Subscribe to our email service to receive the latest updates
