Earnings Drive S&P 500 to Record High
![]() FoolBull
FoolBull
03:00 August 19, 2025 EDT
Key Points:
In August 2025, the S&P 500 index reached a landmark breakout, recording consecutive three-day all-time closing highs and marking a notable year-to-date upward cycle.
Shifts in monetary policy expectations have also supported the S&P 500 by providing liquidity and valuation backing, with the market fully pricing in a 25-basis-point rate cut by the Federal Reserve in September.
If Fed Chair Jerome Powell emphasizes at the Jackson Hole meeting that “inflation still requires monitoring” without reinforcing the rate-cut outlook, the market could reprice the interest rate path, potentially leading to a short-term pullback in the index.
In August 2025, the S&P 500 reached a landmark breakout, recording three consecutive days of all-time closing highs and forming a notable year-to-date upward cycle. On August 12, the index rose 1.13% to close at 6,445.76 points, surpassing the 6,400 level for the first time. On August 13, gains continued with a modest 0.32% increase to 6,466.58 points. On August 14, despite narrower fluctuations, the index edged up 0.03% to finish at 6,468.54 points, completing a three-day streak of record highs.
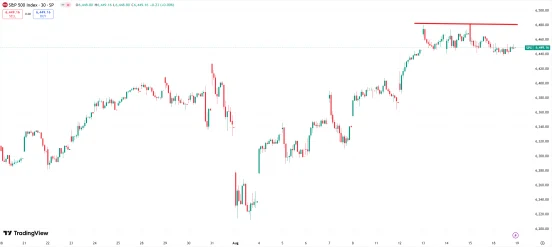
Source: TradingView
From an annual perspective, this gain demonstrates notable continuity. The S&P 500 closed at 5,678.23 points at the end of 2024, representing a 13.9% increase year-to-date through August 14, 2025. The index posted a full-year gain of 23.31% in 2024. Compared with historical cycles, the current index is up 80.8% from the October 2022 interim low of 3,577.03 points. The upward momentum has shifted from “valuation recovery” in 2023 to “earnings-led” in 2025, highlighting significant fundamental support.
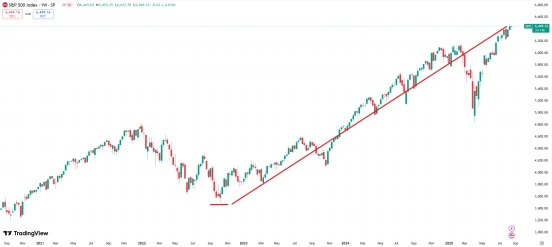
Source: TradingView
Moderate inflation data and expectations for monetary policy adjustments have further reinforced the market. However, market participation remains limited, as only 27 stocks reached 52-week highs on August 14, while 12 stocks hit 52-week lows, indicating a relatively high concentration in the advance.
Earnings Fundamentals Support
Corporate earnings for the second quarter of 2025 exceeded expectations, providing momentum for the S&P 500’s advance.
As of now, 90% of S&P 500 constituents have reported earnings, with year-over-year profit growth reaching 11.8%, nearly three times the initial 4% forecast. This marks the third consecutive quarter of double-digit growth. Revenue increased 4.4%, with 81% of companies beating consensus EPS estimates and 83% surpassing early reports. Profit margins remained steady at 12.1%, supported by effective cost management through supply chain optimization and pricing strategies. The technology and consumer staples sectors performed particularly well, demonstrating operational resilience amid economic pressures.
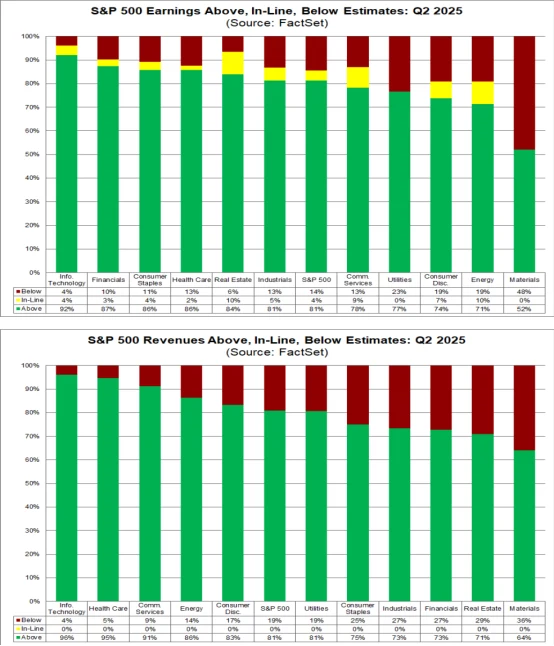
Source: FactSet
Since the end of 2021, analysts have adjusted their 2025 earnings expectations at the fastest pace in years, reflecting growing confidence in corporate growth. Forward 12-month EPS estimates rose from $71.14 last quarter to $73.63. Corporate guidance has turned positive, with the ratio of positive to negative guidance reaching a four-year high, particularly in short-term forecasts. This has driven 2025 full-year EPS growth expectations to 10.3%, with third-quarter growth projected at 8%. These revisions are based on second-quarter outperformance and sustained demand in key industries. Some forecasts remain cautious, however, with annual growth projected in a 6–8.5% range, reflecting potential volatility.
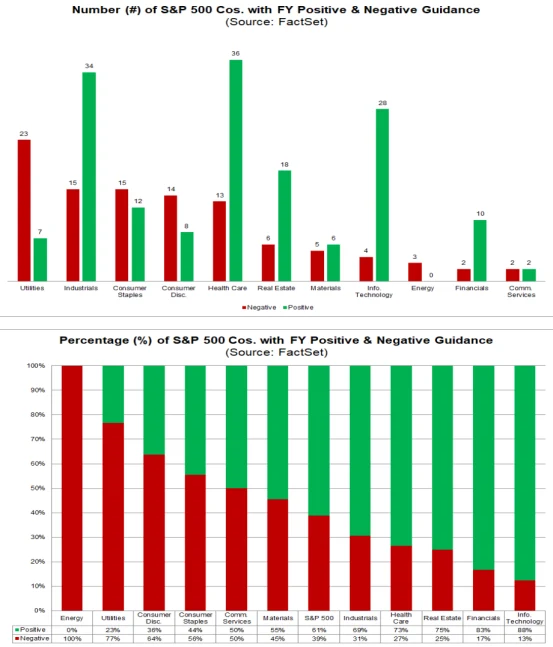
Source: FactSet
The so-called “Big Seven” U.S. tech leaders remain the primary drivers of the S&P 500’s gains. In the second quarter, these companies delivered 26% EPS growth, exceeding consensus estimates by 12%. Investment in AI infrastructure is driving projected 2026 capital expenditures to $461 billion. Technology sector EPS growth for 2025 is expected at 16.9%, slightly lower than in previous years due to base effects and intensified competition. These stocks hold significant weight in the index’s gains, highlighting the concentration risk as non-tech constituents face modest downward revisions.
Notably, despite pressures from higher tariffs and rising labor costs, overall S&P 500 profit margins have remained stable. Second-quarter operating margins stood at 12.1%, unchanged from the first quarter and slightly higher than 11.8% in the same period of 2024.
Estimates indicate that the effective import tariff rate rose to approximately 18.6% by mid-year, with each 5% tariff increase expected to reduce S&P 500 EPS by 1–2%. Companies have mitigated the impact through cost pass-through to consumers and operational adjustments. Additionally, a weaker U.S. dollar has provided incremental EPS gains for exporters, enhancing competitiveness. Revenue growth under a fixed exchange rate has moderated, indicating gradual underlying expansion. Large and mid-sized firms have demonstrated strong adaptability, while smaller companies face higher margin pressures from tariff escalations.
Fed Policy Expectations Ease Marginally
The shift in monetary policy expectations has provided liquidity and valuation support for the S&P 500, particularly after the release of July CPI data, which significantly heightened market expectations for a rate cut.
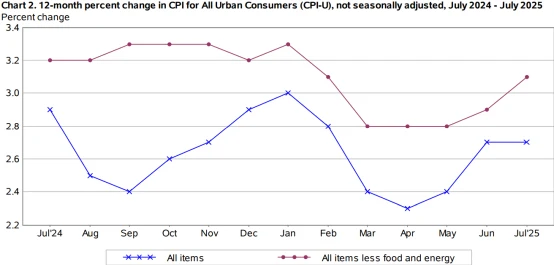
According to the U.S. Bureau of Labor Statistics, the Consumer Price Index (CPI) rose 2.7% year-over-year in July 2025, below market expectations of 2.8% and unchanged from June’s 2.7%. Core CPI, which excludes food and energy, increased 3.1% year-over-year, above the 3.0% forecast and up from 2.9% in June, with a 0.3% month-over-month gain—the largest monthly increase since January. This data partly eased market concerns over “sticky inflation” and further confirmed the trend of declining price pressures.
Source: U.S. Bureau of Labor Statistics
Breaking down the components, core goods CPI rose 1.1% year-over-year, with used car prices falling 2.1%, limiting the increase in core goods prices. Core services CPI rose 4.2% year-over-year, indicating that inflationary pressures have shifted from a “goods + services” dual high to being concentrated in the services sector. This reduces the urgency for Federal Reserve policy adjustments and strengthens market confidence in a potential “soft landing.”
Following the CPI release, interest rate futures markets significantly adjusted their pricing for Federal Reserve rate cuts. According to the CME FedWatch tool, the probability of a 25-basis-point Fed rate cut in September has risen to 83.6%, while the probability of a 25-basis-point cut in December has increased from 35% in early July to 47%.
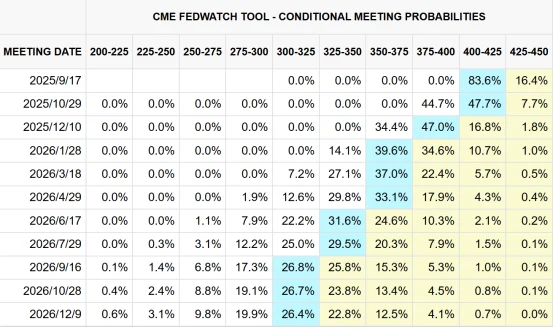
Source: CME
The easing of rate expectations is directly reflected in the Treasury market. The 10-year U.S. Treasury yield fell from a July high of 4.49% to 4.2% in August. Valuation pressure on equities has consequently eased. The S&P 500’s forward P/E ratio currently stands at 19.5x, above the five-year average of 18.2x but below the 2021 peak of 23.8x, and its “equity-to-bond” value relative to the 10-year Treasury remains within a reasonable range.
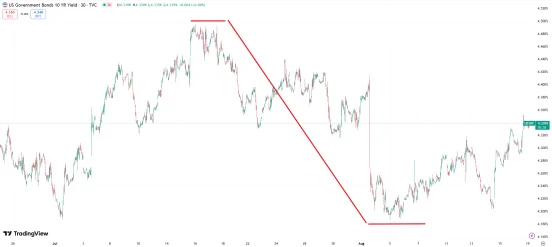
Source: TradingView
Potential Risks
It should be noted that despite the S&P 500 reaching new highs, the market still faces two key potential risks, warranting caution against short-term volatility.
There is a significant divergence between the index’s new highs and individual stock performance, highlighting a lack of market breadth. On August 14, when the S&P 500 hit a record high, only about 27 constituent stocks reached 52-week highs, accounting for roughly 3%, well below the 20%-30% average seen during previous index peaks in 2021. Over the same period, the Russell 2000 Index gained approximately 3% year-to-date, compared with the S&P 500’s roughly 15% gain, indicating that market momentum is concentrated in a small number of large-cap leaders. Should these leaders miss expectations, the risk of an index pullback increases.
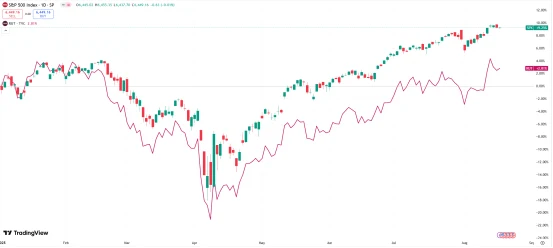
Source: TradingView
In the short term, the Jackson Hole Global Central Bank Symposium (August 21-23) and the September FOMC meeting (September 16-17) are key events. If Fed Chair Jerome Powell emphasizes that “inflation still requires monitoring” without reinforcing rate-cut expectations, the market could reprice the interest rate path, potentially leading to a near-term pullback in the index.
Additionally, potential escalation of tariff policies remains a risk.According to the U.S. Department of Commerce, total U.S. import tariffs in Q2 2025 rose 18% year-over-year, with 48% of small businesses expressing inflation concerns (significantly higher than large firms). Should the scope of tariffs expand further, the resulting profit pressures on small businesses could transmit to the broader market, weighing on overall index earnings growth.
Source: The U.S. Bureau of Economic Analysis
Looking Ahead
Analysts forecast that the S&P 500 could approach 6,500 points by the end of 2025, with some estimates reaching 6,600 points or higher, based on an EPS range of $262 to $275. Expected third-quarter growth of 8% and full-year growth of 10.3% support this outlook, assuming margins and demand remain stable.
Upcoming events, including the Jackson Hole Symposium and the September FOMC meeting, could trigger volatility. If expectations for rate cuts are adjusted, the market may experience a short-term pullback.
Disclaimer: The content of this article does not constitute a recommendation or investment advice for any financial products.

Email Subscription
Subscribe to our email service to receive the latest updates
