Understanding this bull market
14:41 August 16, 2025 EDT
Advisors typically review portfolio performance and hold one-on-one meetings with clients during the summer. This summer and January meetings were no exception, with much of the focus centered on the 15-year bull market in the S&P 500 and Nasdaq, how much longer it could continue, and what the market would look like after it peaked.
A Brief History of Bull and Bear Markets
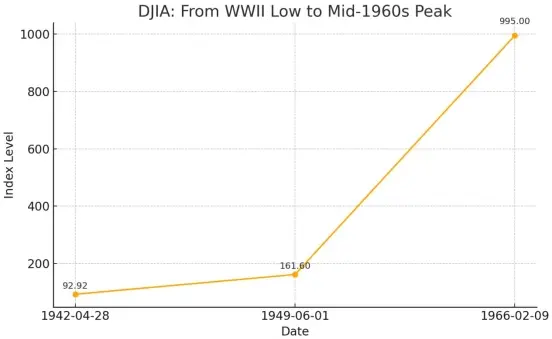
After Japan's surrender in 1945, many economists predicted that the United States would plunge back into the Great Depression, driven by massive disarmament and surging unemployment. After all, the United States had just experienced the Great Depression and 25% unemployment before World War II. However, the reality was quite different. The Dow Jones Industrial Average, a popular index at the time, enjoyed a 23-year rally from 1942 to 1965. The market then traded largely sideways for the next 15 years. (The Dow's low occurred in December 1941, during the market panic triggered by the attack on Pearl Harbor. However, the true breakout is generally considered to have occurred in May 1942, which is considered the starting point of the post-World War II bull market.)
From 1965 to 1980, the US economy faced numerous challenges. The Vietnam War continued to drain the nation's resources, the Watergate scandal rocked the nation's political foundations, and the Arab oil embargo caused gas prices to skyrocket from $0.30 to $3 per gallon. President Nixon was impeached and removed from office, replaced by Gerald Ford. Furthermore, the Soviet invasion of Afghanistan and the Iranian hostage crisis of the late 1970s made this period extremely difficult for the US.
In terms of market performance, the S&P 500 experienced its first 50% bear market between 1973 and 1974. This decline was likely closely linked to the Watergate scandal and the resulting constitutional crisis. While the impact of Nixon and Watergate may seem mild compared to today, it was undoubtedly a significant blow in the market environment of the time. In fact, this was the only 50% correction in the S&P 500 over the 55-year period from 1945 to 1999.

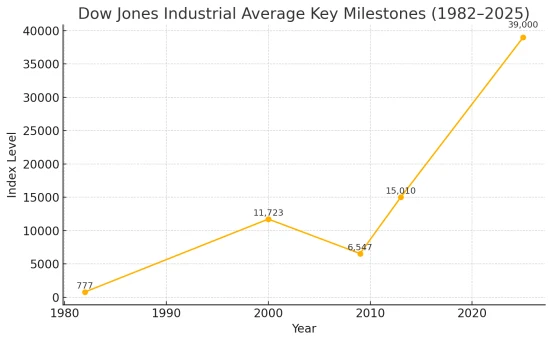
From 1982 to 2000, however, the market landscape shifted dramatically—the United States ushered in the most powerful bull market in history. Technological leaps fueled the economic boom. The widespread adoption of personal computers and the explosive growth in corporate productivity in the early to mid-1980s injected tremendous momentum into the economy. This wave ultimately culminated in the internet era. Netscape's IPO in 1995 ignited the internet boom, arguably one of the most disruptive inventions since the advent of printing.
Historically, the Dow Jones Industrial Average experienced a 23-year bull market after World War II, followed by a 10-15 year period of sideways trading in the 1970s. The 18-year bull market from 1982 to 2000 created the most glorious period of economic and wealth creation in American history.
However, the stock market performance between 2000 and 2009 was dismal—the S&P 500 averaged only about 1.5% annually, and experienced two 50% bear markets during that period. The first bear market deflated the valuation bubble in large-cap growth stocks and the technology sector; the second, which began in late 2007, burst the bubble in the single-family home sector, which had been fueled by excessive credit and soaring prices. Ultimately, the cumulative return for that decade hovered between 11% and 12%.
The S&P 500 index reached its generational low on March 9, 2009, and we are still in the bull market that began there. The starting point for a bull market is crucial. If we consider March 9, 2009, as the starting point, the current long-term bull market has lasted 15 to 16 years. If we consider early May 2013, when the S&P 500 first broke through its all-time high in mid-March 2000, as the starting point, the bull market has lasted approximately 12 to 13 years. Different definitions of starting points not only influence the length of market cycles but also influence investors' expectations and investment strategies for future market trends.

The secular bull market from 1982 to 2000 shares similar characteristics with the current bull market from 2009 to the present, both exhibiting high stock concentration: near its peak in March 2000, the technology sector accounted for 33% of the S&P 500; by the close of trading on August 1, 2025, it comprised 34%. Led by the technology and financial sectors, known as the "generals of the market," the bull market was dominated by the technology and financial sectors. Today, technology (34%) and financials (13.8%) together account for 48% of the S&P 500's market capitalization. While the communications services sector, as it exists today, did not exist in 2000 (consisting solely of traditional telecom companies), it now boasts internet giants such as META, Alphabet, and Netflix. The consumer discretionary sector has also been revitalized by upstarts like Amazon and Tesla, yet the average change in overall market capitalization has been insignificant, which is in itself quite intriguing.
Looking back at the 1990s, the core driving force behind the market was the "long-term expansion of enterprise technology"—first the widespread adoption of personal computers in the 1980s, then the rise of server networks, and finally the explosion of the internet in the mid-1990s. The current equivalent is the industry upgrade and completely reshaped competitive landscape brought about by artificial intelligence. Had Apple entered the consumer tech market in the early 2000s and led the trend with the iPhone and iPad, the tech industry might not have been able to escape the long downturn from 2000 to 2013-2015.
History also presents another echo: in 1999, Julian Robertson, the founder of Tiger Fund and legendary hedge fund manager, chose to withdraw because he could not bear the crazy market of large technology and growth stocks; similarly, in November 2023, Jim Chanos, the founder of the well-known short-selling institution Kynikos Associates, announced the closure of the fund focusing on short-selling. Both top investors were forced to "hand in their papers" in the bull market, but now the market is still booming.
Looking at asset returns, large-cap growth stocks and momentum stocks (primarily technology stocks) continue to dominate, while small- and mid-cap stocks and equal-weight strategies are lagging significantly, just as they did in the late 1990s. This again paints a familiar picture of the end of a long bull market.
Future Trends
In my opinion, the biggest difference between this bull market and the 1990s lies in the pace of market sentiment. Back then, market sentiment tended to shift slowly, but now the transition from "extreme greed" to "extreme fear" (or even outright fear) has accelerated significantly. The frequency and intensity of pessimism are far greater than in the late 1990s.
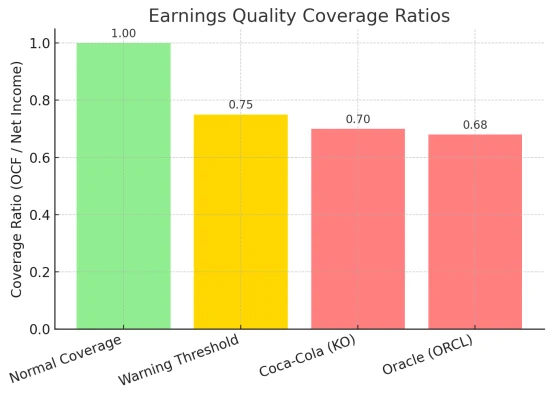
Another notable difference is the relationship between the tech sector's "earnings weight" and its market capitalization. In March 2000, the tech sector accounted for 33% of the S&P 500's market capitalization, but contributed only about 13% to earnings. Today, the tech sector's market capitalization remains around 33%, while its earnings weight is approaching the low 20% range. Earnings quality is generally better today than in the late 1990s. According to a specific measurement method, using the ratio of operating cash flow to trailing 12-month net profit to assess earnings quality, a coverage ratio of around 1x is considered normal, while companies with a ratio below 0.75-0.8x should be viewed with caution. Interestingly, the two companies currently scoring lowest on earnings quality are Coca-Cola (NYSE: KO) and Oracle (NYSE: ORCL), although both companies have publicly addressed this issue.

Therefore, we can see that the risks of simply chasing high returns are accumulating. Despite this, this bull market could still continue until 2029 or 2030. Historical experience shows that changes in economic and market structures over time often drive the transition between bull and bear markets. Therefore, it is reasonable to expect that this rally will last at least several more years.
When constructing a portfolio, clients need to understand the concept of "non-correlation" and its significance for stable returns. Currently, the Russell 2000 Index (IWM) is the most challenging asset to trade, which is why many investors are adding to their portfolios. Furthermore, emerging markets have long been underweight, but more recent analysis has explored their potential value. For growth-oriented or balanced portfolios, the following stocks, which have long lagged the broader market and exhibit low correlation with core holdings, may be worth considering: Nike (NYSE: NKE), Cisco (NASDAQ: CSCO), Intel (NASDAQ: INTC; currently trading around $20, with extremely high capital expenditures, not yet a buy), and IBM (NYSE: IBM), which is finally starting to recover after years of "waiting for Godot."

From an asset allocation perspective, these undervalued and under-represented assets, with low correlation to core assets, often act as a buffer within a portfolio. When overvalued sectors experience volatility, these undervalued or under-allocated assets may instead perform reliably, thereby mitigating overall drawdowns. With the current bull market having lasted for years and some popular sectors experiencing excessive gains, a moderate introduction of these assets not only helps diversify risk but also potentially captures additional returns during style rotations.
This is based on the logic of long-term capital preservation and compound growth. As history has repeatedly proven, bull markets don't last indefinitely; market style shifts and valuations eventually return. When sentiment shifts from extreme optimism to rationality, or from fear to repricing, overlooked high-quality assets often have the opportunity to recover their valuations.
Ultimately, whether this bull market cools down over the next few years or reaches new heights, propelled by new technological waves, investors must recognize that the essence of wealth accumulation lies not in accurately predicting peaks. Rather than trying to bet on short-term fluctuations, it is better to maintain a defensive position in your asset allocation, so that you can move forward steadily in the long run, regardless of the cycle of bull and bear markets.
Disclaimer: The content of this article does not constitute a recommendation or investment advice for any financial products.

Email Subscription
Subscribe to our email service to receive the latest updates
