GDX is about to rebound and may see a strong breakthrough during the peak season
![]() FoolBull
FoolBull
08:12 August 9, 2025 EDT
Often overlooked, gold stocks have performed exceptionally well this summer and are currently consolidating near their long-term highs, demonstrating strong technical momentum. This is driving a positive outlook for the VanEck Gold Miners ETF (GDX) as we head into the traditional peak season. Despite recent flattish gold prices, GDX continues to hit new long-term highs, maintaining a steep uptrend for the broader gold stock market. Key moving averages remain well-supported, maintaining a bullish technical outlook, while overbought conditions are gradually easing.
The core of technical analysis is to use historical price movements to predict possible future trends in the short term. Prices are determined by the actions of countless traders in the market, so prices themselves reflect all known information.
Since its launch in mid-May 2006, GDX has become a leading indicator for the gold mining sector. As of mid-week, GDX's assets under management reached $15.2 billion, far exceeding its next-largest competitor. Tracking the world's largest gold mining companies with annual production exceeding one million ounces, GDX is one of the most important tools for monitoring gold stock performance.
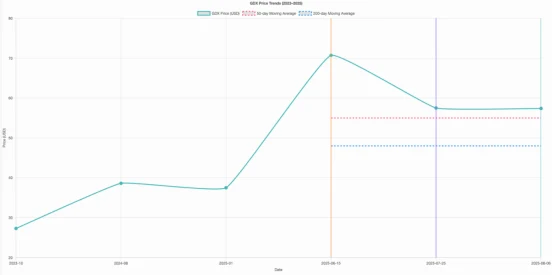
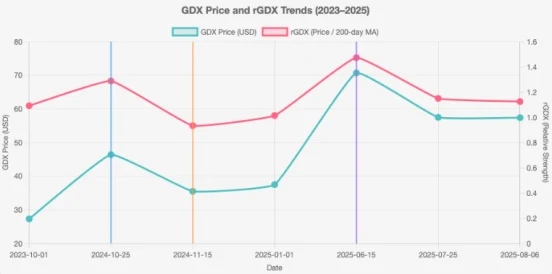
Gold DX (GDX) has performed exceptionally well in 2025, gaining 52.7% since the beginning of the year. From early October 2023 to late July 2025, its cumulative gain has reached 110.3%. This surge in gold stocks is closely tied to the robust bull market in gold itself. In particular, in mid-June, GDX surged as high as 88.6%, with no pullback exceeding 10% during this period, demonstrating strong market enthusiasm. However, it's worth noting that the overall growth of gold stocks still lags slightly behind that of gold itself.
Historically, GDX typically amplifies material gold price fluctuations by a factor of two to three to compensate for the additional risks borne by gold stocks. These risks include not only operational and geological uncertainties, but also geopolitical factors, which further amplify gold price volatility.
However, in this round of gold bull market, the increase in GDX is only 1.2 times that of gold, which is significantly lower than previous expectations, reflecting the phenomenon of "insufficient follow-up", which makes a round of strong compensatory rally urgent, and the current technical form of GDX is indicating that such compensatory rally may be imminent.
As gold is expected to start its next upward breakthrough, gold stocks and ETFs represented by GDX are very likely to usher in a strong upward trend.
GDX Trend
GDX's recent bull run can be divided into two distinct phases. The first phase, which began in early October 2023 and lasted until late December 2024, was a relatively modest rally. However, GDX still gained 70.2% over 12.6 months, reaching a more than four-year high in late October 2024. Notably, GDX wasn't extremely overbought at that time—according to the technical indicator "relative GDX" (rGDX), which divides the GDX closing price by its 200-day moving average, a ratio typically around 1.30 constitutes an overbought threshold.
The benefit of rGDX is that it converts GDX fluctuations into normalized multiples, eliminating the influence of absolute price fluctuations and creating a horizontal range for easy comparison. Over the past five years, rGDX has repeatedly encountered technical resistance around 1.30. At the end of October 2024, GDX's rGDX reached 1.288, which is high but not yet extreme.
However, as Trump's unexpected election victory sparked market concerns about high tariffs, the US dollar strengthened rapidly, triggering a concentrated sell-off in gold prices, which fell sharply. This decline was amplified by the GDX. By mid-November, gold had only retreated 8.0%, but the GDX had plummeted 23.4%, with a retracement leverage of 2.9x, representing a bear market-level sell-off.
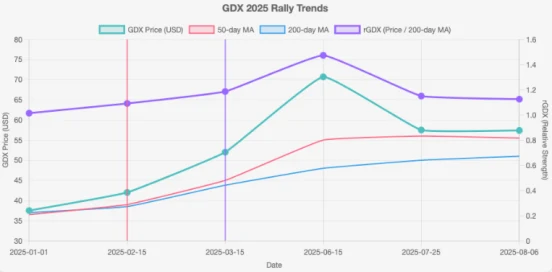
Following this pullback, gold stocks quickly rallied, entering a stronger second-phase rally that achieved several key technical breakthroughs in 2025. The first signal came in mid-February 2025, when the GDX's 50-day moving average crossed above its 200-day moving average, creating a "golden cross" buy signal, often considered a bull market accelerator. Subsequently, in mid-March, the GDX again broke above 1%, reaching a 12-year high. At this point, rGDX was only 1.186, indicating further upside potential.
During this phase, GDX exhibited a typical upward trend: the stock price repeatedly surged and consolidated within an ascending channel, followed by brief pullbacks or sideways movements to release overheated sentiment. During the 2025 trend, many core gold stocks continued to rise on the back of strong gold prices, leading to a period of extreme optimism. This was followed by a gradual erosion of gains through moderate selling and technical consolidation, representing a healthy bull market performance during this phase.
This trend also suggests that gold stocks are gradually breaking away from their previous stagflationary pattern and transitioning to a more dominant technical rhythm. As long as gold prices remain strong, gold stocks are expected to continue to gain momentum and maintain their upward trend.
GDX History
In mid-April 2025, Gold Dividend DX (GDX) soared to a 12.5-year high of $51.91, briefly entering extreme overbought territory, with the price trading at 1.321 times its 200-day moving average (200dma). However, this overbought condition was short-lived, as the gold stock quickly retreated to support within its ascending channel and near the crucial 50-day moving average. Notably, repeated support near the 50-day moving average is a hallmark of a strong bull market. Technically, Gold Dividend DX has repeatedly rebounded from this level this year.
Entering early June, the major gold stocks resumed their upward trend, reaching a new 12.7-year high as summer approached. Despite a 3.5% gain that day, GDX remained less overbought than in mid-April—its 200-day moving average was 1.304, down from 1.321 at its previous high. This demonstrates a key trend: as the rally continues, the market becomes more resilient to higher prices. The continued rise of the 200-day moving average also suggests a transition to a higher technical structure.
Against this backdrop, GDX might have seen some profit-taking in the summer of 2025. However, the sector has been trading sideways for the past few months, finding support near its 50-day moving average and repeatedly hitting long-term highs in mid-June and late July. Just last week, GDX hit a new 12.8-year closing high of $54.48, demonstrating continued technical strength.
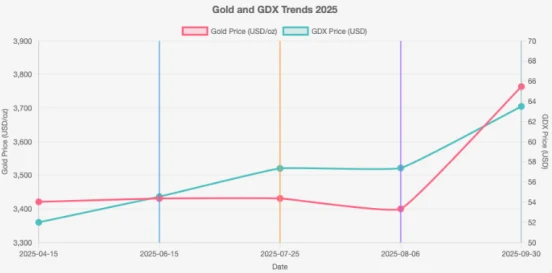
The stability of this technical pattern is further reinforced by observing gold's performance. Since reaching a record high of $3,421 in mid-April, gold prices have remained volatile, with numerous attempts to break higher failing to materialize. For example, in mid-June, gold rose only 0.3% from its previous high to $3,431, while the Gold Derivatives Index (GDX) rose 4.9% during the same period, significantly outperforming the gold price. This outperformance was repeated in late July, with the GDX surging 5%, while the gold price remained only 0.3% higher than mid-April.
Gold stocks have generally shown strength relative to gold throughout the summer, with this outperformance directly driving continued improvement in the sector's earnings. Considering upcoming seasonal factors, technical signals suggest significant upside potential for gold stocks in the coming months. Autumn, winter, and spring are traditionally peak seasons for gold demand, driven particularly strongly by the Indian market, initially driven by post-harvest gold purchases and then by a surge in demand for gold jewelry during the wedding season.
The Federal Reserve Chairman's hawkish remarks mid-week sent gold prices plummeting to just above their late-June lows. However, in last week's article, I predicted a 10% rise in gold prices this autumn. This would be driven not only by Indian consumer demand but also by reallocations by US stock investors and gold futures speculators. Currently, allocations by both groups of investors to gold remain historically low, leaving significant room for further growth.
If the gold price rises 10% as expected, gold stocks typically see a 2-3x increase, corresponding to a potential 20-30% gain for GDX by the end of September. Based on the late June low of $50.73, this implies a potential move to the $61-66 range for GDX, a very attractive upside potential. However, it's not just these technical signals that prompted me to write this article.
While technical analysis is very useful in trading, it lags behind and can often only show strength after reaching new highs, only to be followed by a pullback. Therefore, technical signals are more sustainable if they are supported by solid fundamentals. Currently, the fundamentals of gold stocks are also very convincing.
The second quarter 2025 earnings season is underway, and gold mining companies are reporting impressive results, thanks to the profit leverage effect of high gold prices. In fact, as early as six weeks ago, at the end of June, I wrote that although mining costs have risen slightly, they are far less than the increase in gold prices, and therefore the gold bull market is continuing to amplify miners' profits.
For example, based on their historical cost and profit margin models, I estimate that their unit earnings for the second quarter will increase by approximately 74% year-over-year. This is just another strong performance in a string of recent quarters. Over the past seven quarters, this profit metric has achieved year-over-year growth of 87%, 47%, 31%, 84%, 74%, 78%, and 90%, respectively, demonstrating a clear trend of earnings growth.
Gold miners are currently experiencing a surge in earnings reports. In the coming weeks, numerous high-performing companies will continue to report earnings exceeding expectations, attracting more professional funds to invest. Institutional investors have long held very low allocations to gold stocks, but strong fundamentals will become a crucial signal they must pay attention to.
Newmont's recent performance illustrates this point. Although the industry leader's sluggish production growth and high costs have long been considered a drag on GDX's performance, the company's second-quarter results were still impressive. Against the backdrop of a 1% drop in gold prices and a sluggish overall sector, Newmont's stock price bucked the trend, soaring 6.9%, driving GDX up 1.2% that day and turning a market that should have been declining into a positive one.
The core reason is that Newmont, the only gold mining stock in the S&P 500, reported adjusted earnings per share of $1.43, a 98.6% year-over-year increase and far exceeding market expectations of $1.04. This performance pleasantly surprised institutional investors unfamiliar with gold stocks.
If even a "slow bull" like Newmont can achieve such profitability, then mid-sized miners with stronger fundamentals and growth potential will have even greater potential for explosive growth. We have been focusing on small and medium-sized gold mining companies with clear production growth, better cost structures, and greater profit margins - they are the most worthy core targets in this round of gold bull market.
In contrast, mid-tier gold miner New Gold (NYSE: NGD), a GDX component, released a strong second-quarter earnings report on Monday. Gold production increased 14.6% year-over-year to 78,600 ounces, while all-in sustaining costs (AISC) rose only 0.9% to $1,393 per ounce. Even more impressive, adjusted earnings per share soared 450% year-over-year to $0.11. New Gold also reiterated its midpoint production forecast for 2025, reaching 345,000 ounces, a 15.7% year-over-year increase.
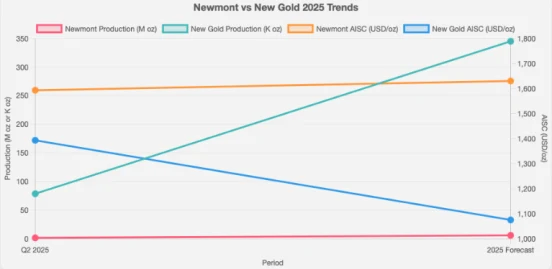
The company projects an AISC of just $1,075 for the full year 2025, a 13.2% year-over-year decrease. Newmont's performance, by contrast, is significantly worse: its second-quarter production fell 8.0% year-over-year, while its AISC rose to $1,593 per ounce. Its full-year 2025 guidance is even more disappointing, with production projected to fall 13.9% year-over-year, while its AISC rises 7.5% to $1,630. This set of data reflects pressure on both Newmont's operational efficiency and profitability.
Even so, Newmont's stock price has seen strong gains against a backdrop of overall sector weakness and generally mediocre earnings. This suggests that small and medium-sized miners with strong performance and superior fundamentals should have greater potential for explosive growth. Record earnings in the second quarter not only increased traders' interest in gold stocks but also accelerated capital inflows, driving stock prices higher. Due to their lower base and relatively cheap valuations, mid-sized and small miners often experience growth far faster than large companies.
A similar situation occurred in 2024. Against the backdrop of a 27.2% surge in gold prices that year, GDX rose only 9.4%, significantly lagging behind. Newmont, the largest component, saw its share price plummet 10.1% throughout the year, becoming the primary drag on GDX's underperformance. Further complicating matters, Newmont's disappointing third-quarter 2024 financial report, with an AISC significantly exceeding expectations, caused its share price to plummet 14.7% in a single day, a significant event that dragged down GDX.
Another key rationale supporting GDX's continued strength is that gold stocks remain significantly undervalued relative to gold itself. Despite the sharp rise in gold prices since mid-July 2024, gold stock prices have remained stagnant, significantly out of sync with the gold price trend that drives their earnings growth. Gold stocks still have significant room to run, simply to catch up with current gold price performance and not factoring in further potential price increases.
Looking back at the entire market since early October 2023, gold has risen 88.6% since entering its cyclical bull market, while GDX has seen its maximum gain of 110.3%, corresponding to a leverage ratio of only 1.2x, far below the historical average. Considering that gold stocks historically typically have a 2x to 3x leverage, GDX's current gains should have reached 177% to 266%. Furthermore, during gold's previous 40%-plus rally in August 2020, GDX surged 134.1%, with a leverage ratio of an astonishing 3.4x. Therefore, based on historical data, gold stocks should have outperformed the broader market long ago.
Therefore, the technical outlook for GDX remains extremely positive. Gold stocks have not only successfully absorbed the high volatility in gold prices during the summer, but have also consistently reached new highs relative to gold. Since the beginning of the year, GDX has advanced along a steep upward trend, repeatedly finding support at its 50-day moving average, demonstrating a robust bullish structure. Furthermore, as its 200-day moving average gradually rises, overbought pressures are easing even as GDX reaches new highs.
These solid technical signals are sufficient to support the continued growth of gold stocks during the upcoming autumn peak season. Even more compelling than the technical analysis is the robust fundamental data released by gold miners. Second-quarter 2025 financial reports show that most companies continue to break historical profit records, continuing the earnings surge that began in 2023. This trend is likely to attract a large number of professional funds, driving valuation recovery and price revaluation of gold stocks, and gradually normalizing their correlation with gold prices.
Disclaimer: The content of this article does not constitute a recommendation or investment advice for any financial products.

Email Subscription
Subscribe to our email service to receive the latest updates
