High Beta Mania: Is This Market's 1999 Moment?
![]() FoolBull
FoolBull
08:19 August 10, 2025 EDT
At the current stage, the market is being driven by extreme speculative sentiment, and investors' desire for exponential returns is growing, leading them to prefer high-beta and volatile stocks.
It's important to emphasize that we can't yet confirm whether we're currently in a typical melt-up phase. The market's current performance may simply reflect a short-term increase in risk appetite. Even if this is indeed a melt-up, we can't say whether it's nearing its end or whether there's still ample room for further gains.
What is certain is that since the market hit a temporary low in April, investors have become significantly more active in high-risk, highly speculative assets. This rally will eventually come to an end. It may end with a systemic decline in the broader market and the bursting of the high-beta asset bubble, a repeat of the dot-com bubble. However, another path is also possible: while speculative assets experience a pullback, more value-oriented, low-beta stocks can perform steadily, maintaining the overall stock index's strong performance.
To more clearly identify the current stage, we looked back at market performance during the dot-com bubble in 1999. Many of the characteristics of that time bear striking similarities to today's market conditions, making them worth learning from and pondering.
In the late 1990s, the economic promise, potential profits, and growing market hype brought by the internet gradually became the focus of investors. From 1995 to the market peak in early 2000, the S&P 500 index rose by over 200%. However, this journey was not smooth. In the summer and fall of 1998, the global financial turmoil triggered by the collapse of Long-Term Capital Management (LTCM) and the Russian sovereign debt default caused the market to pull back by nearly 20%.
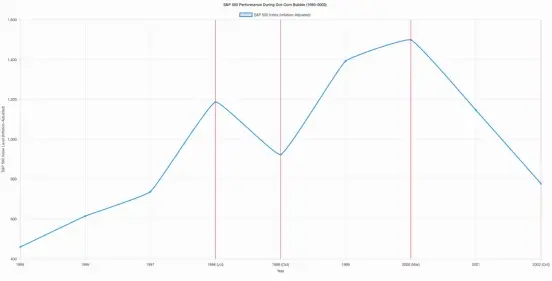
However, after the crisis, the market rebounded quickly. From the interim low on October 8, 1998 to the high in March 2000, the S&P 500 index rose strongly by nearly 70%, ushering in the last wave of frenzy before the bursting of the Internet bubble.
Beta
From 1995 to September 1998, the market was in an overall upswing, a broad-based rebound that saw strong performance across nearly every style and market cap. By grouping stocks into deciles based on their beta coefficients, we can more clearly see the distribution of returns across different risk levels during this period.
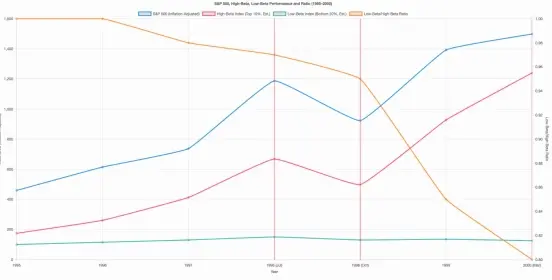
The data shows that during this rally, returns across all beta groups were roughly similar, suggesting that the market rally was broad-based and not dominated by a small number of high-risk stocks. Notably, the returns of the lowest and highest beta deciles were lower than the average of the middle range.
This phenomenon suggests two important points: first, low-beta stocks may be relatively less attractive in the early stages of a bull market or when sentiment is high due to their strong defensiveness; second, high-beta stocks may be too volatile and face higher uncertainty, which in turn fails to effectively translate into excess returns.
After a market correction of approximately 20% in the summer and fall of 1998, market sentiment shifted significantly. Investors' risk appetite increased significantly, with funds rapidly flowing into stocks with the highest beta coefficients, while interest in more defensive, less volatile stocks waned.
Data shows that the top 10% of high-volatility stocks, ranked by beta coefficient, saw average gains exceeding 100% during this period, becoming the focus of capital chasing. In contrast, the bottom 20% of stocks performed poorly, with an overall slight decline, demonstrating a clear trend of style rotation.
Another intuitive way to measure the difference in returns is to compare the ratio of the price indexes of stocks with the lowest and highest beta coefficients. The data shows that this ratio remained almost stable from 1995 to September 1998, indicating that high-beta and low-beta stocks performed relatively similarly.
But by March 2000—about a year and a half after the market melt-up began—the ratio had fallen by nearly half, reflecting a significant divergence in the performance of high-beta stocks compared to low-beta stocks during that period.
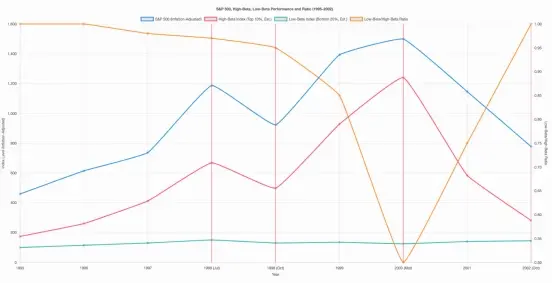
It is worth noting that this ratio experienced a sharp reversal after March 2000, which provides us with an important clue - when the melt-up is nearing its end, how the asset allocation is adjusted may depend on whether the critical point of this style rotation is detected in time.
Following the 1999 melt-up surge in high-beta stocks and the subsequent sharp correction, the current market environment appears to be mirroring that period. Similar to 1998, the market has recently experienced a significant correction after a period of strong gains. This decline was triggered by a new round of tariffs, with the S&P 500 falling nearly 15% from mid-February to early April. The entire process was swift and dramatic.
However, during this rebound, the market structure has clearly changed. The "Big Seven" and other large-cap growth stocks with solid performance that led the market in 2023 and 2024 have gradually retreated to the sidelines, replaced by speculative stocks related to artificial intelligence and cryptocurrencies that have become investors' new favorites.
While some of these companies are profitable, many remain loss-making or under significant financial pressure. Despite this, investors remain optimistic about their potential growth stories and, more likely driven by a profit-driven mentality, are chasing short-term gains, betting that these companies will unleash greater growth potential in the future.
While the current market environment bears some resemblance to the boom-bust cycles of high-beta stocks in the dot-com era, there are also key differences, and only time will tell.
Indeed, some phenomena in this round of market fluctuations are reminiscent of those in 1999: rising speculative sentiment, high-volatility stocks leading the rally, and investors' boundless anticipation for future technologies. However, it cannot be ignored that today's market structure is completely different from that of that year.
First, the internet has matured considerably, and the current market driver is artificial intelligence, a technology still in its early stages and yet to be widely monetized. At the same time, information dissemination has become significantly more efficient, leading to a faster trading pace and making investor behavior more susceptible to emotion, which is quickly reflected in prices.
Secondly, economic fundamentals have also undergone profound changes. Economic growth is weaker today than it was 25 years ago, and the Federal Reserve is maintaining high interest rates, rather than cutting them as quickly as it did in 1998. Back then, in the face of the Long-Term Capital Management crisis and the Russian default, the Fed urgently cut interest rates by 3 percentage points, then resumed raising them in 1999. Now, the Fed is at the end of its rate-hike cycle, and while quantitative easing hasn't been phased out, its marginal impact has significantly diminished.
Furthermore, to address the systemic risks brought about by the Y2K crisis in 2000, the Federal Reserve injected large amounts of liquidity into the banking system, which may have inadvertently fueled the market rebound in late 1999. Currently, however, the Fed has not released a similar amount of liquidity, and the market is more driven by sentiment and technical expectations.
So while history appears to be repeating itself, the context, pace, and structure are different. What is certain is that market speculation has increased significantly since the April lows. The key questions now are: How long can this risk appetite persist? And what will be the cost when the bubble bursts?
Disclaimer: The content of this article does not constitute a recommendation or investment advice for any financial products.

Email Subscription
Subscribe to our email service to receive the latest updates
