Golden Cross Strikes Again: Is a New S&P 500 Bull Run Just Beginning?
03:37 July 18, 2025 EDT
As the second half of 2025 begins, the U.S. stock market has flashed a key technical signal. On Tuesday, July 1, the S&P 500 formed its first “golden cross” since February 2023—when the 50-day moving average crosses above the 200-day moving average.
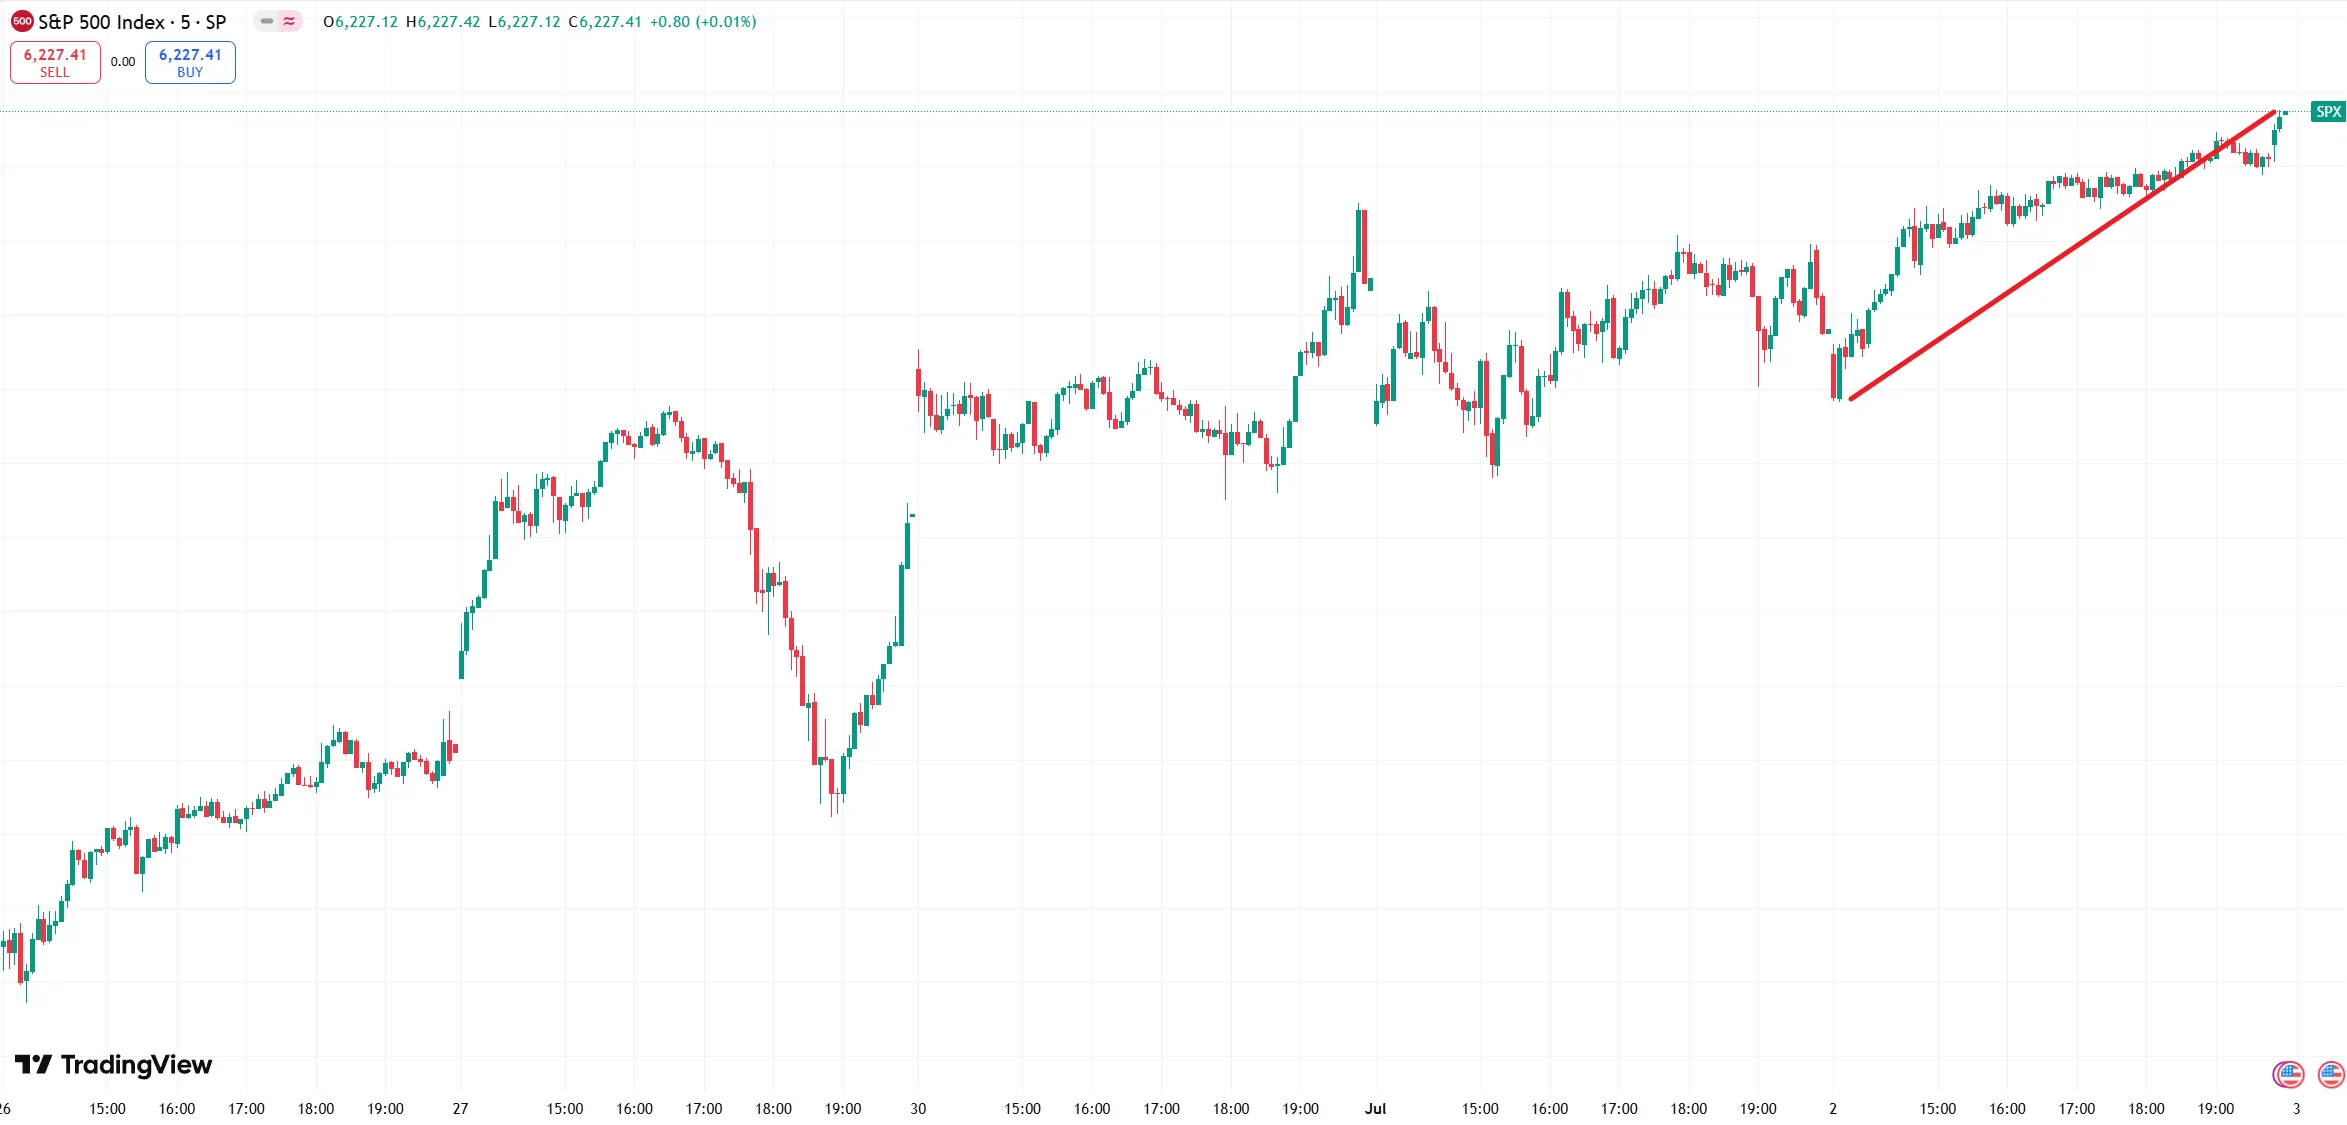
Source: TradingView
In technical analysis, this pattern is often seen as a sign that the market trend is turning upward. But does it also suggest that a new bull cycle could be underway?
Golden Cross: A Bullish Technical Indicator
A golden cross refers to the 50-day moving average breaking above the 200-day moving average, signaling that short-term price momentum is overtaking the long-term trend. This pattern is typically associated with strengthening bullish momentum. According to Dow Jones Market Data, since 1928, the S&P 500 has posted gains 71% of the time in the 12 months following a golden cross, with an average return of 10%—compared to a long-term average of about 8%. Over the last 20 golden crosses, the probability of gains has climbed to 85%, with the S&P 500 rising more than 13% on average.
From a technical perspective, a golden cross usually unfolds in three phases: in the first, the market bottoms and forms a base; in the second, the short-term moving average breaks above the long-term moving average; and in the third, the uptrend is confirmed.
On July 3, 2025, the S&P 500 closed at a record high of 6,227.42, up 0.47% on the day. As of now, the index has completed the first two phases of the golden cross pattern, with the short-term moving average trending higher—suggesting growing buying momentum.
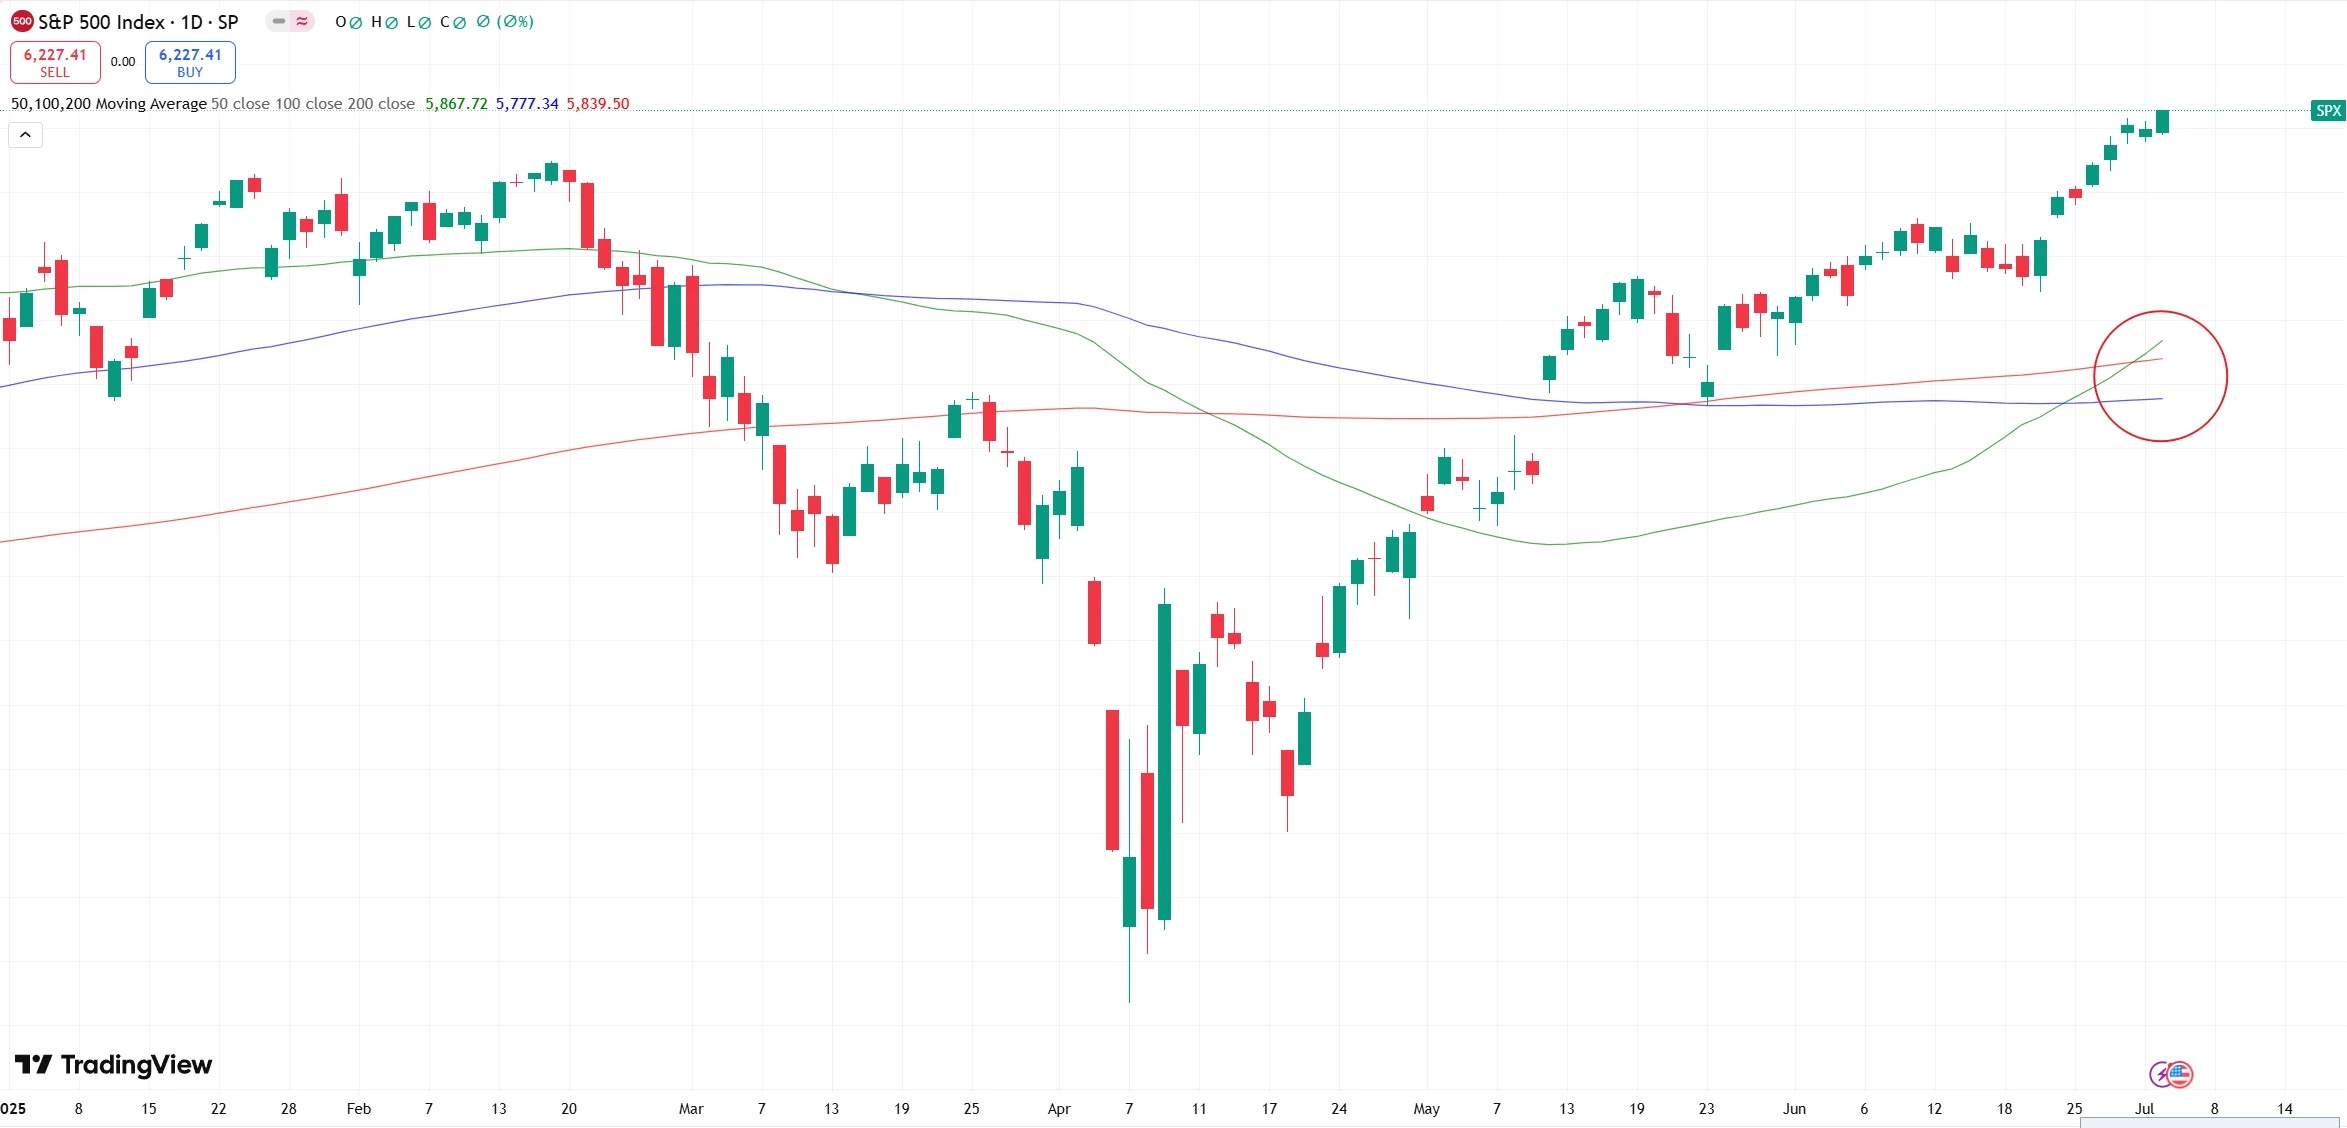
Source: TradingView
Importantly, this golden cross is not an isolated signal. In late April, the Zweig Breadth Thrust indicator was triggered—a historically rare event with a 100% success rate since 1982. On June 27, the S&P 500 set a record for the fastest return to new highs after a drawdown of more than 15%, further confirming a shift to a more constructive technical setup.
The golden cross is also appearing beyond the S&P 500. The Nasdaq Composite completed its own golden cross this Monday. Key tech names like Nvidia, Microsoft, and Meta continue to display strong technical setups, with Nvidia having just formed its own golden cross in late June. Meanwhile, the Russell 2000 index has rebounded sharply and is approaching a key technical threshold—reflecting broader market participation.
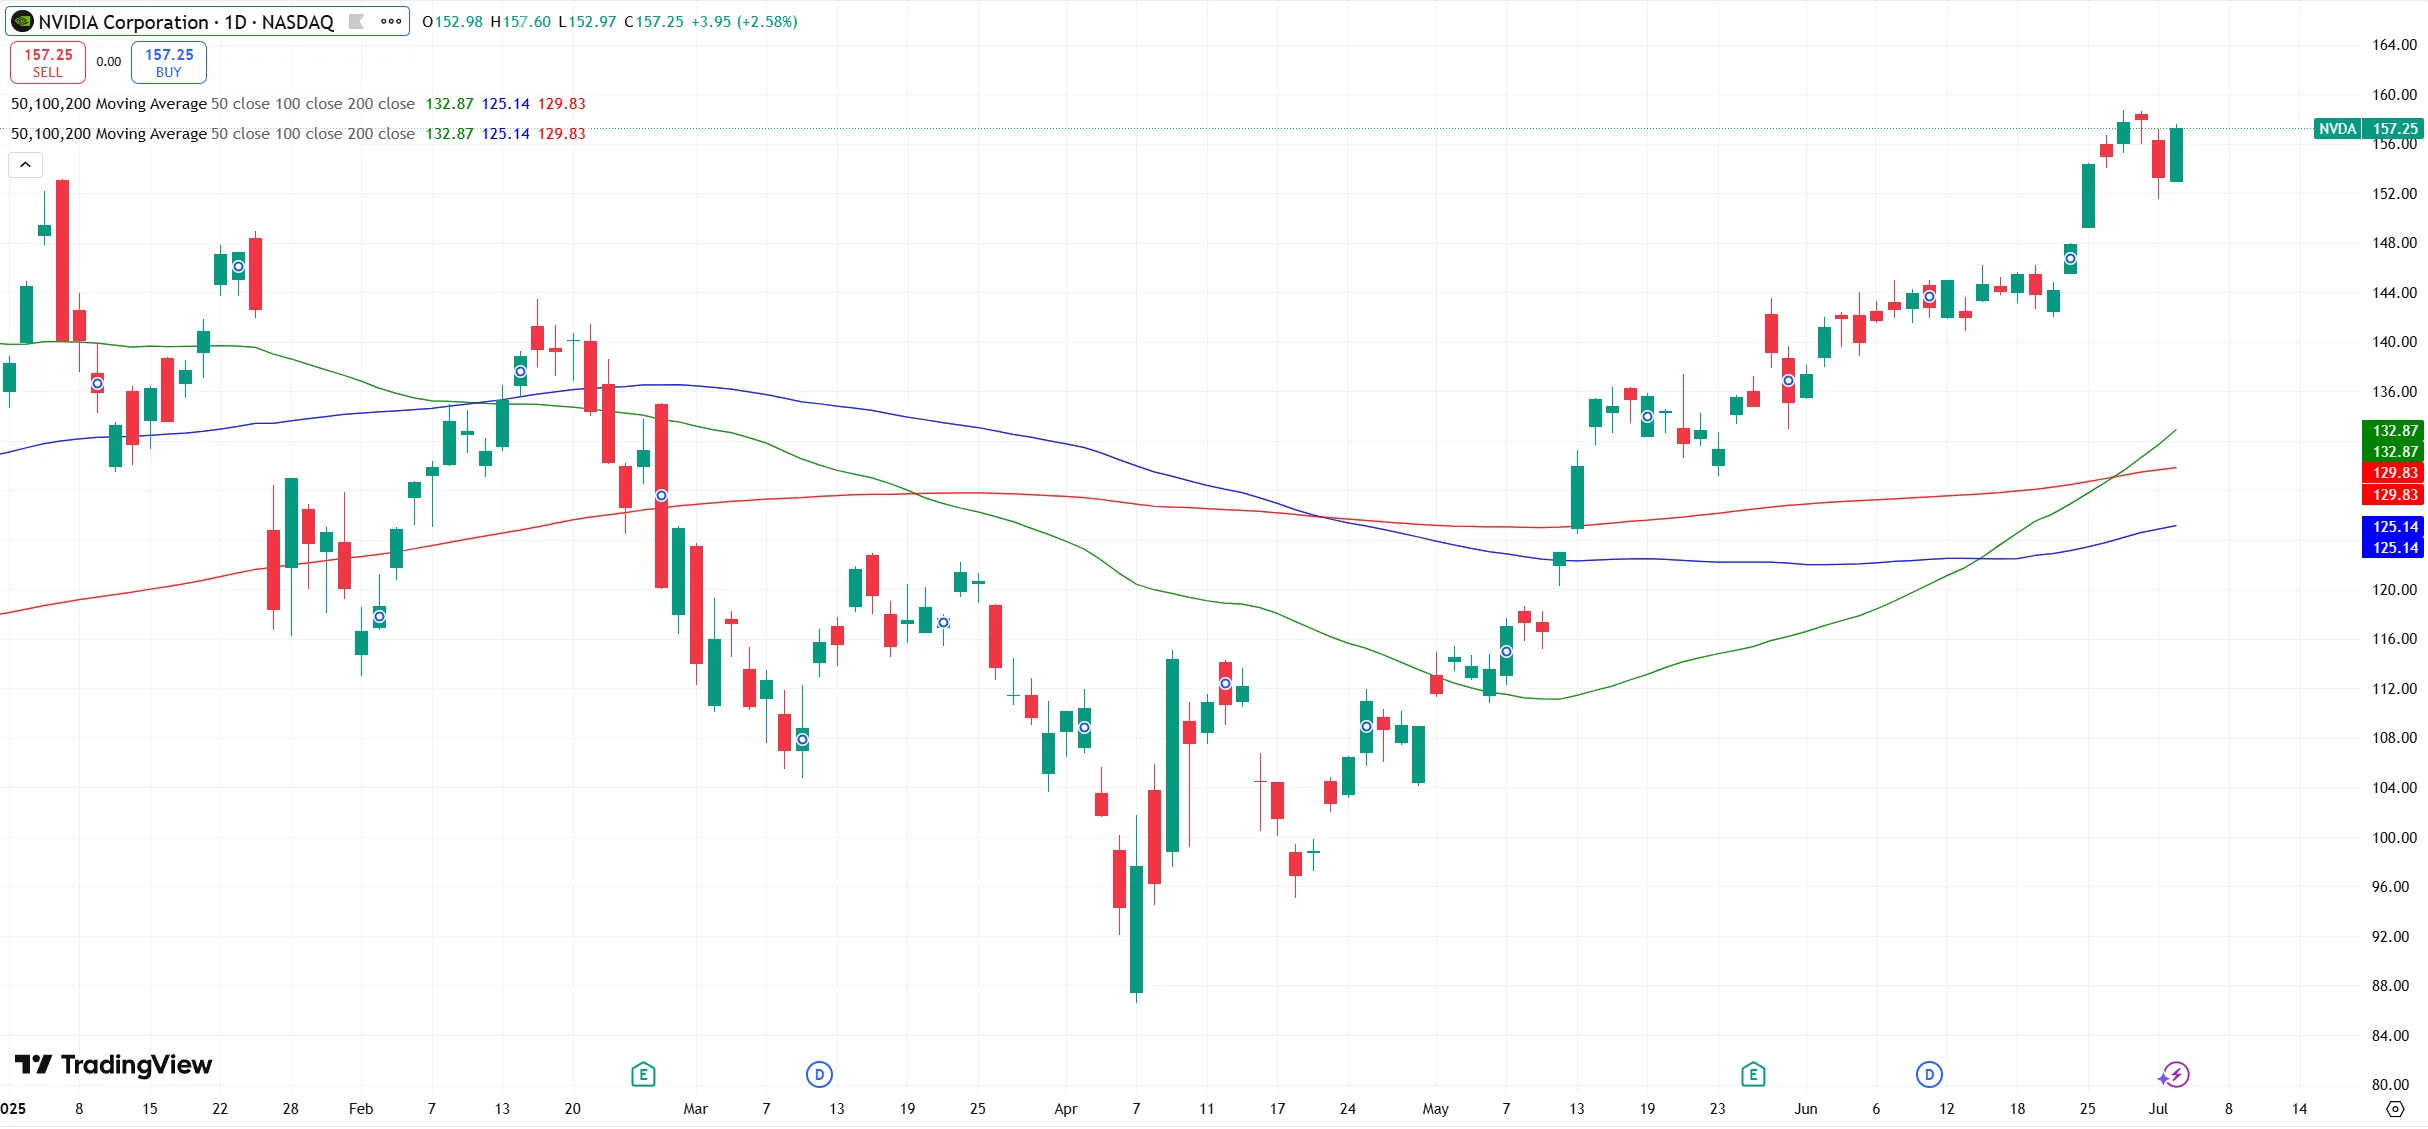
Source: TradingView
Craig Johnson, chief market technician at Piper Sandler, noted, “The golden cross is a sign of a healthy market. With market breadth expanding and small- and mid-cap stocks gaining traction, the second half of 2025 has the structural foundation for further upside.”
Fundamental Support
Behind the technical improvement lies relative stability in corporate earnings and the macroeconomy. FactSet data shows that overall EPS growth for S&P 500 constituents in Q2 2025 is expected to exceed 8% year-over-year, marking the fourth consecutive quarter of growth. The technology, financials, and industrial sectors are the largest contributors, with AI and cloud-related spending continuing to drive earnings expansion.
On the economic data front, recent employment indicators suggest initial softening in the labor market. The ADP private-sector employment report released on July 3 showed a decline of 33,000 jobs in June—the first monthly drop since March 2023—against economists’ prior expectation of a 100,000 job increase.
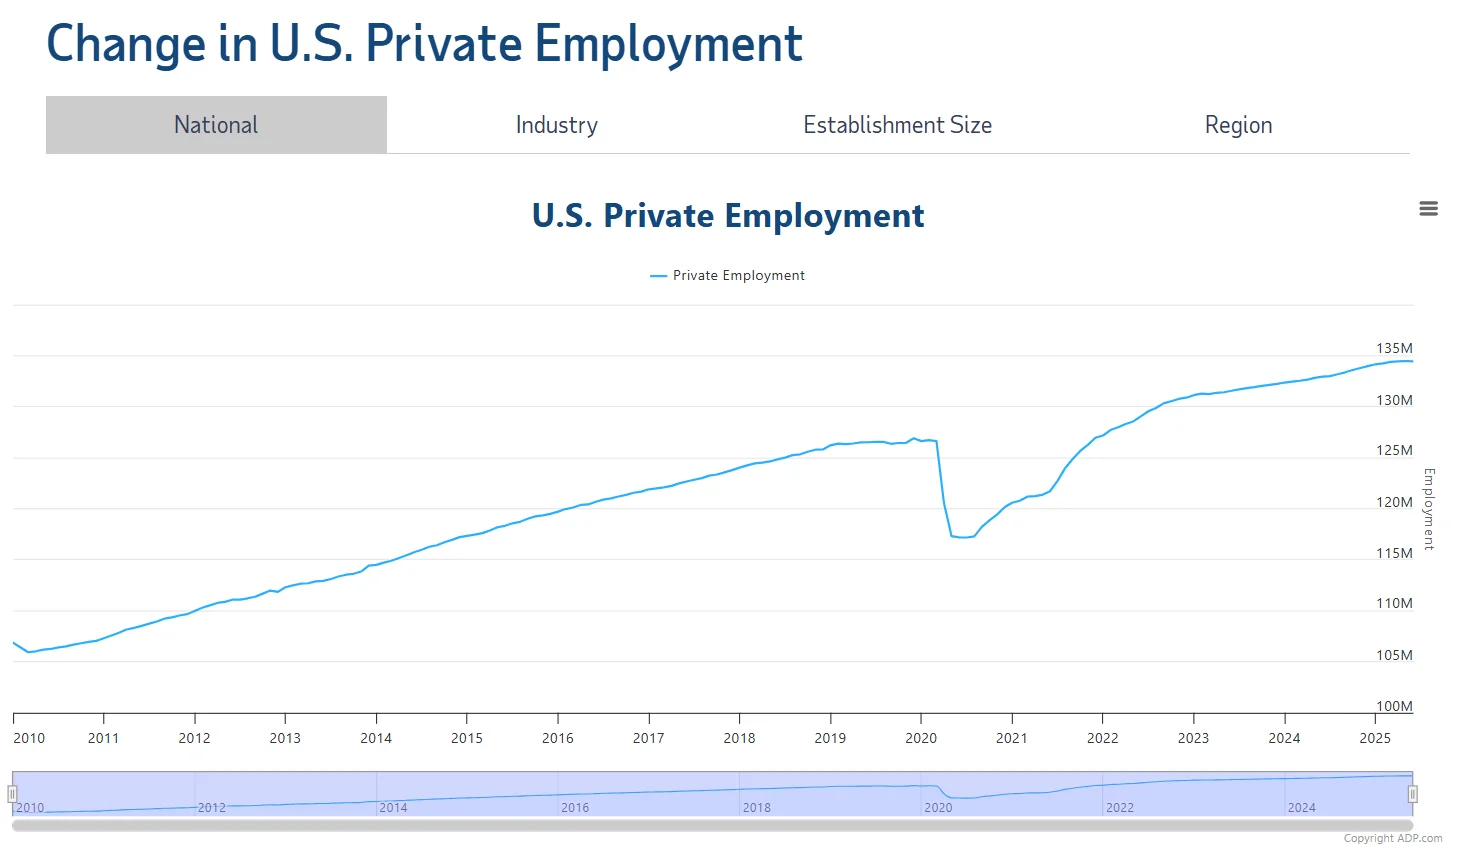
Source: ADP
Although ADP’s accuracy in forecasting nonfarm payrolls is limited, this weakness may prompt the Federal Reserve to pay closer attention to labor market conditions at its late-July meeting.
Markets will closely watch the upcoming July 4 nonfarm payrolls report, which is forecasted to show 110,000 new jobs. Another miss below expectations could reinforce bets on an economic slowdown and Fed rate cuts.
Federal Reserve Chair Jerome Powell reiterated a “data-dependent” approach this week, without ruling out a rate cut at the July meeting. According to the CME FedWatch tool, the market currently prices in nearly a 70% chance of three rate cuts in 2025. Goldman Sachs expects the Fed may begin gradually shifting policy as early as July or September, depending on inflation trends and tariff impacts.
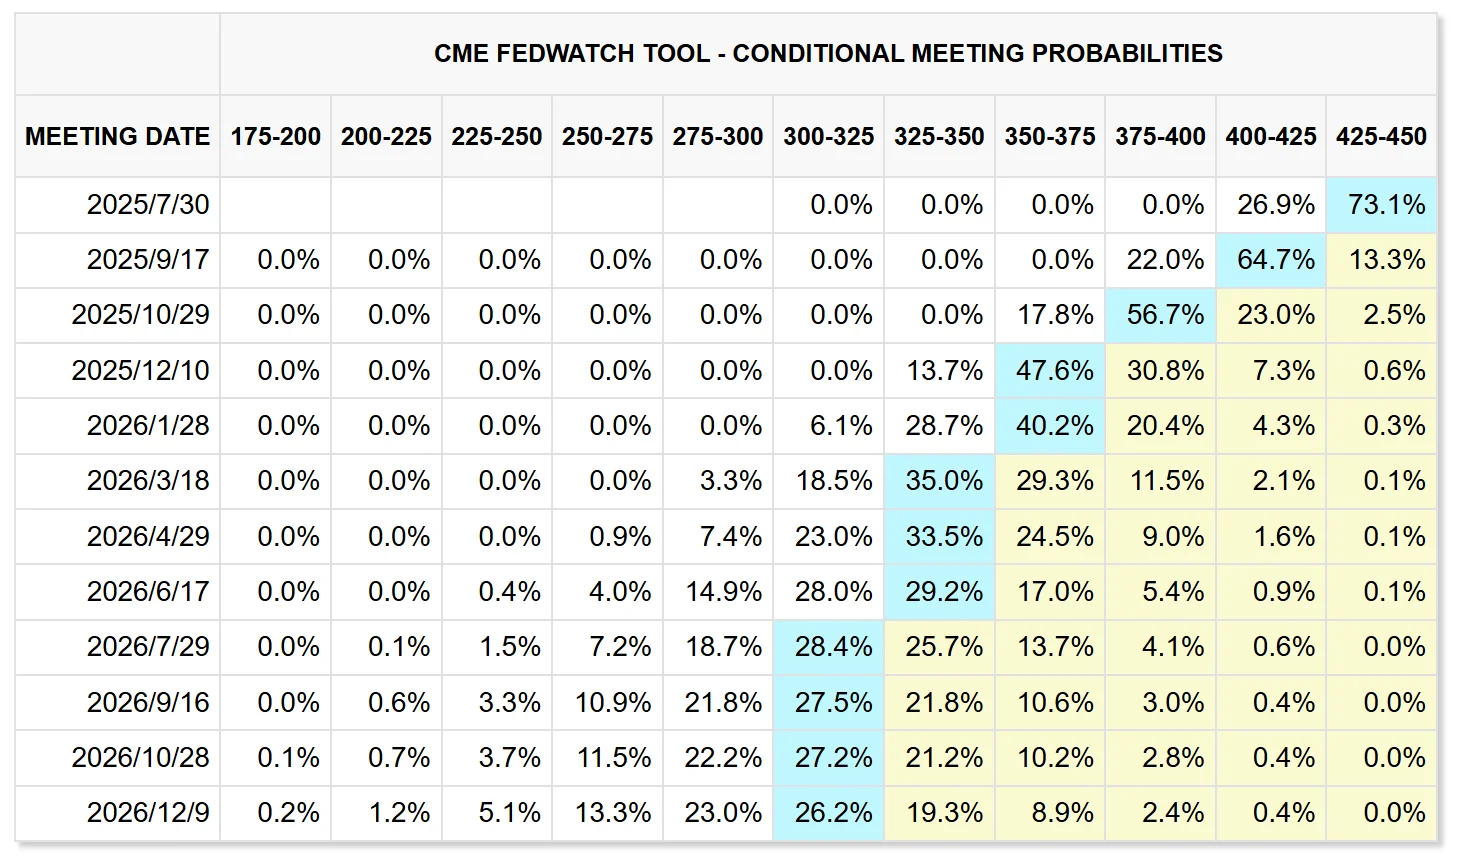
Source: CME
Tariff Negotiation Progress
Tariffs remain a key focus for the market.
In April, the Trump administration announced a 90-day pause on the “reciprocal tariffs,” with the suspension set to expire on July 9.
On July 2, the U.S. and Vietnam reached a trade agreement imposing a 20% tariff on Vietnamese exports to the U.S., a 40% tariff on transshipped goods, while Vietnam applies zero tariffs on U.S. products, especially SUVs. This deal boosted market sentiment and fits the Trump administration’s “Threaten And Compromise Option” (TACO) pattern.
The U.S.-Vietnam trade agreement has somewhat lifted market morale, but concerns over tariff spillovers remain unresolved. According to media reports, Trump stated on social media that Vietnam will “fully open its market” to the U.S., while the U.S. will impose a 40% tariff on goods transshipped through Vietnam from other countries. This suggests the next phase of tariffs could have broad spillover effects, potentially impacting Asian supply chains and global pricing structures.
Notably, Trump has yet to clarify his stance on the next round of tariffs against other trade partners. Given that his campaign strategy may continue to rely on trade policy pressure, investors should watch for the impact of “political uncertainty premiums” on market volatility.
Besides Vietnam, progress in trade negotiations with other major partners remains limited. If the tariff suspension is not extended, new tariffs could raise corporate costs and consumer prices, adding further pressure and influencing the Fed’s policy path. Markets will need to closely monitor tariff developments after July 9.
Risks Remain
Overall, the S&P 500 has triggered its first golden cross since February 2023, signaling a new, positive technical cycle. Corporate earnings continue to grow, and although macro data show signs of slowing, no systemic risks have emerged. The Federal Reserve may begin a easing cycle within the year, providing a valuation cushion.
However, Trump’s tariff policies remain a key variable shaping market momentum. If policy remains uncertain, it could trigger fluctuations in corporate investment and consumer confidence over the medium term.
Additionally, with the index approaching historic highs, the risk of a technical pullback should not be overlooked. Especially amid ongoing macro uncertainties, market sentiment remains vulnerable to sudden shocks.
Disclaimer: The content of this article does not constitute a recommendation or investment advice for any financial products.

Email Subscription
Subscribe to our email service to receive the latest updates
