Second Half of 2025: Headed for a Market Meltdown or a New Leg Higher?
![]() FoolBull
FoolBull
02:53 May 21, 2025 EDT
Key Points:
1. The marginal contribution of consumer spending to the market is weakening, and it may no longer serve as a core driver of sustained
gains in U.S. equities going forward.
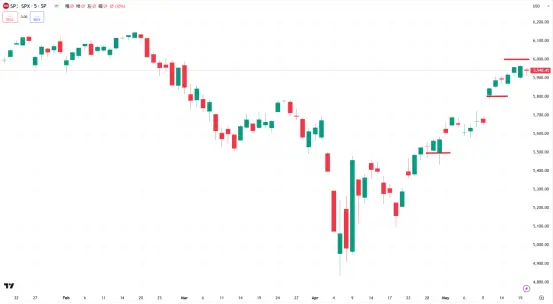
2. The S&P 500 currently sits between its early-year high of 6,147 and its recent low of 5,800, reflecting a consolidation pattern.
3. Some analysts believe a systemic crash is unlikely this year, but elevated uncertainty and stretched valuations are expected to cap
the market’s upside potential.
As of 2025, U.S. equity markets have experienced significant volatility.The S&P 500 fell into bear market territory in April following a sharp
sell-off triggered by former President Trump’s tariff policy. However, the index staged a strong rebound from its lows, posting consecutive
gains. The rally not only erased losses sustained after the tariff announcement, but also gained further momentum amid positive
developments such as signs of U.S.-China tariff relief. As a result, the index has been closing in on its record closing high.
While the rebound has helped ease some of the market’s earlier pessimism, the momentum has stalled. On May 21, all three major U.S. stock
indexes declined, with the S&P 500 falling 0.39% to close at 5,940.46, snapping a six-day winning streak. The index had been pushed to the
brink of a new bull market thanks to that consecutive rally.
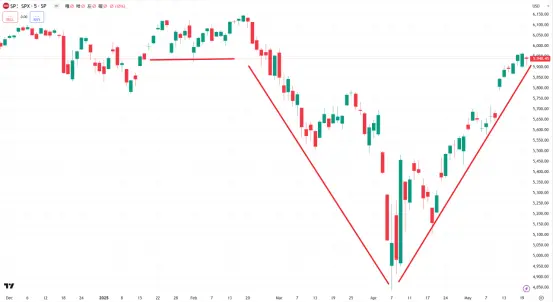
S&P 500 – Source: TradingView
With high interest rates, policy uncertainty, and slowing economic growth still weighing on sentiment, the big question for the second half of
the year remains:Will the market continue its rebound and set new highs—or slip back into turmoil and begin a fresh leg lower?
Pressure on economic fundamentals
Recent economic data continue to point to signs of sluggish growth in the U.S. economy.
According to the U.S. Department of Commerce, GDP contracted at an annualized rate of 0.3% in the first quarter of 2025—marking the
worst quarterly performance since 2022.
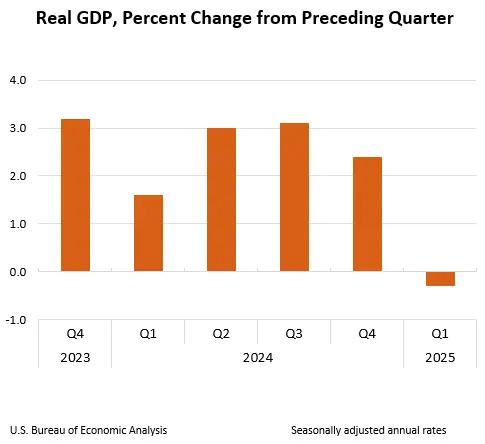
Source: U.S. Department of Commerce
The consumer sector presents a disconnect between “weak reality and strong expectations.” In April, the Consumer Price Index (CPI) rose
2.3% year-over-year, with core CPI up 2.8%, indicating that inflation remains moderate and manageable. However, the University of
Michigan’s Consumer Sentiment Index dropped to 50.8 in May—its second-lowest reading on record. Meanwhile, one-year inflation
expectations surged from 6.5% in April to 7.3%, suggesting weakening consumption momentum.
Consumers’ outlook on the labor market has turned sharply pessimistic, with expectations of rising unemployment over the next five years
hitting the highest level since July 2020—and the highest short-term job market pessimism since 2009. Still, the labor market has yet to
show signs of systemic deterioration. The U.S. economy added 177,000 nonfarm jobs in April, and the unemployment rate held steady at a
low 4.2%.
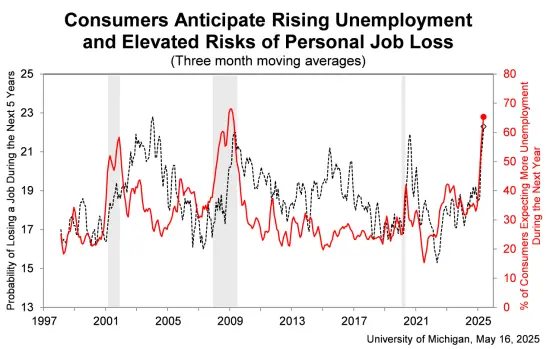
Consumer Unemployment Expectations – Source: University of Michigan
Overall labor market resilience continues to provide a buffer for the economy, helping prevent a sharp deterioration in consumption and
reducing the risk of systemic fallout. However, as consumer momentum gradually weakens, its marginal contribution to equity market
performance is also fading—making it increasingly unlikely to serve as a key driver of sustained upside in U.S. stocks.
Corporate earnings outlook
Corporate earnings in the U.S. equity market showed strong performance in the first quarter of 2025.According to LSEG data, S&P 500
companies posted earnings growth of 12.9% for the quarter, significantly beating the pre-season consensus estimate of 6%. Notably, net
profit growth among non-Mag 7 constituents reached 18%, well above the 9% increase recorded by the Mag 7, indicating a broader
improvement in the earnings trajectory.
Importantly, on May 12, the White House announced the removal of 91% of existing tariffs on Chinese goods and the suspension of a
planned 24% tranche of new tariffs. China responded with equivalent tariff relief. This short-term de-escalation boosted market optimism
around the sustainability of corporate earnings.
However, even with tariff relief, the average effective U.S. import tariff rate remains elevated at 16.4%, meaning that supply chain and cost
pressures on companies are far from resolved. Policy uncertainty also remains high. If the White House fails to reach an agreement with key
trading partners within 90 days, the suspended tariffs could be reinstated.
Looking ahead, full-year earnings expectations have been revised down. Analysts have cut their S&P 500 earnings growth forecasts from
14% at the start of the year to 8.5%—a downgrade steeper than the historical average. During periods of economic slowdown, such
earnings forecasts are often subject to further downward revisions. JPMorgan CEO Jamie Dimon has also warned that S&P 500 earnings
projections have already begun to decline due to the initial tariff impact, and that estimates for the next six months could fall from roughly
12% earlier this year to flat or zero growth.
Currently, the S&P 500’s forward price-to-earnings ratio stands near 24x—well above the 10-year median of 18x. With valuations at
historically elevated levels, any significant deterioration in earnings expectations would directly undermine the market’s upward momentum.
Risks are particularly mounting in the AI sector. In February, China-based DeepSeek open-sourced a cutting-edge AI model, disrupting the
global AI competitive landscape and creating potential headwinds for earnings expectations among U.S. tech giants. If the AI bubble were to
burst, the fallout could ripple across the tech sector—and possibly drag down the broader market as well.
Technical analysis
As of May 21, 2025, the S&P 500 stood at 5,940—down from the year-to-date high of 6,147, but sharply rebounding from its late-April lows.
From a technical perspective, the index is currently trading in a clear consolidation range between 6,000 and the recent support level of
5,800.
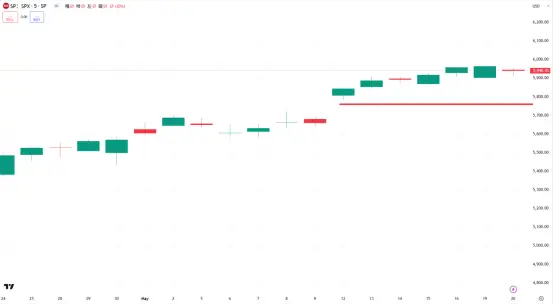
S&P 500 – Source: TradingView
The 6,000 level now represents the first major resistance zone, aligned with the upper bound of a previous consolidation area. A decisive
breakout above this level could open the path for a retest of the early-year high near 6,200. On the downside, 5,800 is seen as key near-
term support; a break below this threshold could expose the index to further downside toward 5,500.
S&P 500 – Source: TradingView
From an indicator standpoint, the S&P 500 has regained its 50-day moving average, while the 200-day moving average—currently near
5,764—continues to provide strong medium-term support. The RSI is approaching overbought territory above 70, suggesting short-term
strength, while the MACD has yet to form a bullish crossover, indicating that medium-term momentum remains uncertain.
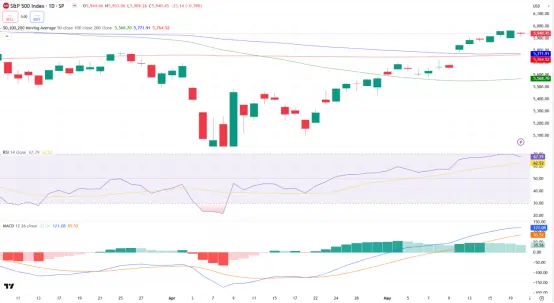
S&P 500 – Source: TradingView
Wall Street outlook
Investor sentiment toward the second half of the year has turned increasingly cautious.
According to a recent Barron’s survey, pessimism among top Wall Street fund managers and their clients has surged to its highest level in
nearly 30 years. About 32% of managers are bearish on the market’s 12-month outlook, while only 26% are bullish; the rest remain neutral.
Notably, 65% of respondents believe the U.S. stock market could decline by more than 20% from its peak in 2025. The top concerns cited
include slowing economic growth, potential recession, political volatility, and a resurgence in inflation.
Back in December 2024, Wall Street’s median year-end target for the S&P 500 was 6,600. However, that target has since been revised
downward, with most current forecasts narrowing to around 5,900.
With the S&P 500 now hovering near 5,945, most projections suggest the market may remain flat through year-end—indicating a broadly
sideways trend for the second half of 2025. In the absence of policy clarity or fresh data catalysts, market direction remains uncertain. While
the consensus does not foresee a systemic crash this year, elevated valuations and persistent macro uncertainties continue to cap upside
potential.
Disclaimer: The content of this article does not constitute a recommendation or investment advice for any financial products.

Email Subscription
Subscribe to our email service to receive the latest updates
