Option Buy-Side Strategies: From Risk Asymmetry to Advanced Structuring
![]() FoolBull
FoolBull
11:59 June 25, 2025 EDT
Compared to the stable income characteristics of option writing strategies, option buying involves paying a premium to acquire the right to
buy or sell an underlying asset at a predetermined price within a specific time frame. Its core advantage lies in limited downside risk—
maximum loss is capped at the premium—while upside potential is theoretically unlimited.
This strategy is essentially a leveraged risk allocation tool tied to the direction, magnitude, and volatility of the underlying asset’s price
movement. It naturally forms an asymmetric risk-reward profile, where a fixed cost is exchanged for nonlinear upside potential, making it
well-suited for probabilistic investment decisions in uncertain market environments.
Core Mechanics of Option Buying Strategies
The core mechanism of long option strategies lies in the quantifiable asymmetry between risk and reward.
The payoff profile of options is significantly influenced by the dynamic behavior of the Greek letters in the Black-Scholes model, with Theta
representing the rate of time decay. Since in-the-money (ITM) and at-the-money (ATM) options carry a higher proportion of time value, their
time decay accelerates more noticeably. For example, an ATM option with 30 days to expiration may exhibit a Theta of approximately –0.04
per day, whereas a deep out-of-the-money (OTM) option may have a Theta of only –0.01 per day, highlighting the disparity in time value
erosion across different moneyness levels.
Meanwhile, Vega measures the sensitivity of an option’s price to changes in implied volatility (IV). When IV is at the 90th percentile of its
historical range, the volatility risk premium expands accordingly, increasing the pricing volatility of options. In addition, Delta reflects the
directional sensitivity of the option’s price to the underlying asset. ITM options usually have a Delta greater than 0.5, ATM options are
around 0.5, and OTM options fall below 0.5. The value of Delta changes nonlinearly with the underlying price, driven by Gamma, which
captures the curvature of Delta’s response.
On top of this asymmetry, the duality of leverage plays a critical role in shaping the risk management approach for buyers. Leverage is
calculated as the product of the underlying asset price and the absolute value of Delta, divided by the option premium. This leverage ratio is
inversely correlated with the strategy's probability of success. For instance, if the underlying asset trades at 100, an OTM call with a
premium of 5 and Delta of 0.2 results in a leverage of 40x, implying high exposure and low probability of profit. In contrast, an ITM option
with a 20-point premium and Delta of 0.8 yields a 4x leverage, reflecting a more conservative position with a higher win rate and more
controlled risk.
By contrasting these scenarios, investors can better grasp the quantitative logic and practical application behind the risk-reward trade-offs
in option buying strategies.
Core Risk Dimensions of Option Buying Strategies
For option buyers, the main risks to manage include directional exposure, time decay, volatility mispricing, and liquidity constraints.
Directional risk can be hedged through a Delta-neutral setup or by offsetting positions based on volatility expectations, helping cushion
against sharp, one-way moves in the underlying.
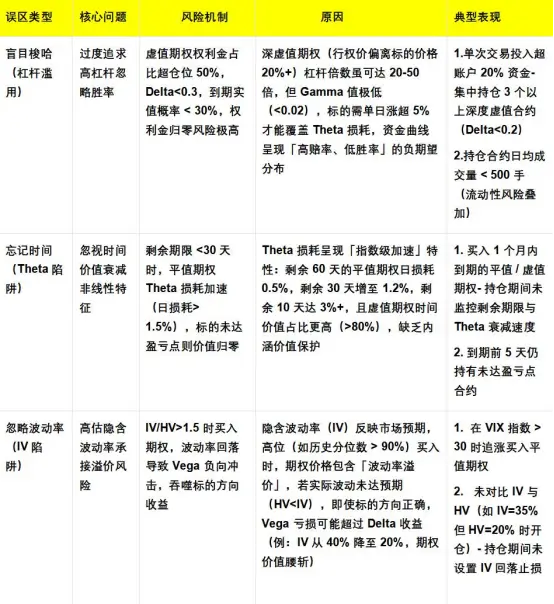
Time decay, or Theta risk, becomes especially punishing as expiration nears. Once inside the 30-day window, at-the-money options often
lose more than 1% of their premium per day, making it harder to stay profitable without quick price action.
Volatility risk is mostly about implied volatility (IV). If IV contracts or gets misaligned with historical volatility (HV)—say, when IV is
overpriced while actual market movement remains low—option values can drop fast, even if price direction is favorable.
Liquidity risk comes from poor market depth and wide spreads. For example, if the bid-ask spread on a deep OTM contract exceeds 10% of
the premium, transaction costs rise steeply. That’s why many traders focus on liquid names with over 1,000 contracts in daily volume and
tight spreads under 5%, to keep execution clean and efficient.
Primary Strategies
Long option strategies mainly consist of single-leg strategies, volatility strategies, and spread strategies, each aligning with different market
outlooks and risk preferences.
1. Single-Leg Strategies: Directional Plays
These strategies are centered on directional speculation, typically involving long calls and long puts.
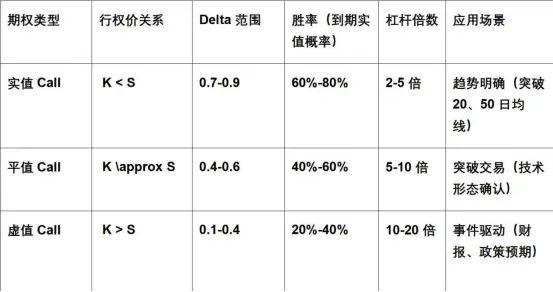
A long call breaks even at the strike price plus the premium paid, with maximum loss capped at the premium.
Example: If the underlying trades at 20, and a 3-month at-the-money call with a 21 strike costs 0.8, the breakeven is 21.8. If the stock rises
to 25, the profit reaches 3.2, delivering a 400% return, with Delta rising from 0.5 to 0.95. If the price remains flat at 20, the option expires
worthless.
Common use cases include:
Technical breakout trades (e.g., after breaking the neckline of an inverse head-and-shoulders with RSI > 50, buy 1–2 month ATM calls),
Event-driven trades (e.g., buying 110% OTM calls 30–45 days before earnings or M&A),
Synthetic longs via combining short stock with long calls for risk hedging.
A long put breaks even at the strike price minus the premium, with the maximum loss still limited to the premium.
Example: If the underlying trades at 100, and a 3-month OTM put with a 95 strike costs 1.5, a drop to 85 yields a profit of 8.5, or a 566%
return, with Delta shifting from -0.3 to -0.9. If implied volatility rises from 25% to 35%, the option gains an extra 1 in value due to Vega,
offsetting time decay.
In practice:
Fundamentally driven puts are often selected around 1.2x price-to-book strike levels,
Volatility-timing setups focus on pre–black swan positioning,
Liquidity screens often require over 1,000 contracts in average daily volume.
2. Volatility Strategies: Two-Way Risk Exposure
These strategies focus on capturing volatility swings regardless of direction, with classic setups including the straddle and strangle.
A straddle involves buying an ATM call and ATM put with the same expiration, creating a Delta-neutral profile.
Max loss = total premium paid
Breakevens = strike ± total premium
Greeks: Gamma ≈ 0.05 per $1², Vega highly sensitive, Theta decay steep at ~–0.06/day
Use cases:
Macro events (e.g., entering 30 days before a Fed meeting),
Calendar arbitrage (e.g., long near-term IV vs. short far-term IV)
A strangle buys OTM call and put, expanding the strike range to lower the premium.
Example: If the stock is at 100, a straddle costs ~4 and needs >4% move to break even, while a strangle costs ~2 but needs >6% move—
reducing cost by 52% but raising the volatility threshold by 50%.
3. Spread Strategies: Risk-Reward Structuring
Spread strategies aim to optimize payoff structures using combinations of long and short legs.
A bull call spread involves buying a lower strike call and selling a higher strike call.
Net cost = premium paid minus premium received
Max profit = strike difference – net cost
Optimal risk/reward (1:1) occurs when strike width is twice the net premium.
Advanced variations include:
Butterfly spreads: buy calls at two outer strikes and sell two calls at a middle strike—ideal for range-bound markets, such as during earnings
blackout periods.
Calendar spreads: long far-month call and short near-month call—designed to profit from Theta decay in the near leg and IV roll-down,
often used in volatility term structure arbitrage.
Advanced Risk Management Framework
The advanced risk management framework primarily covers position sizing, volatility monitoring, and dynamic adjustment, employing
systematic measures to ensure the robust operation of long option strategies.
1. Position Sizing Controls
Position limits for individual trades are set according to risk tolerance and the expected maximum number of loss occurrences. Specifically,
the cap is fixed at 1.6% of net asset value, derived from an 8% risk tolerance multiplied by a maximum of 5 loss events, providing a prudent
safety margin.
Additionally, the framework dynamically adjusts the allocation to out-of-the-money (OTM) option positions based on the ratio of implied
volatility (IV) to historical volatility (HV):
When IV/HV falls below 0.8, OTM position sizing can be increased up to 40%,
Conversely, when IV/HV exceeds 1.2, the allocation is reduced to 20% to mitigate risks from overestimated volatility.
2. Volatility Monitoring Mechanisms
Volatility monitoring focuses on IV-HV premium levels and volatility surface risk:
If IV/HV rises above 1.5, the strategy halts opening new positions, and a stop-loss is triggered if IV declines by 20%, protecting against rapid
volatility reversals.
When IV/HV drops below 0.8, the strategy prioritizes acquiring high-Gamma near-the-money options in the front 20% of the strike range,
aiming to capitalize on mean reversion of historical volatility.
To control short-term spikes, the framework avoids exposure to volatility surface risk by steering clear of contracts expiring within 10 days
that exhibit sudden IV jumps exceeding 30%.
3. Dynamic Adjustments
Dynamic tools ensure real-time alignment between position size and risk exposure:
If the underlying asset price rises over 50% with less than 30 days to expiration, the current contracts are closed, and positions are rolled
into the next quarterly expiration at the same strike to maintain directional exposure.
When volatility declines cause option value to depreciate by over 30%, the strategy closes 50% of the position and transitions into a bull call
spread by selling higher strike calls to reduce costs and hedge risk.
For Greeks management, if Delta moves outside a predefined 0.3 to 0.8 band, positions are adjusted or spot hedges executed to keep risk
metrics within acceptable boundaries, ensuring portfolio stability and flexibility.
Overall, this risk management framework combines quantitative thresholds with tactical controls, significantly enhancing the resilience and
return stability of long option strategies amid complex market environments.
Core Drivers of Profitability in Long Option Strategies
Successful implementation of buy-side strategies requires avoiding three major pitfalls: directional misjudgment, underestimation of time
decay, and volatility mismatch. The core lies in precise positioning ahead of volatility spikes.
This demands establishing a three-dimensional analysis framework—technical, fundamental, and volatility—and converting probabilistic
advantages into profits through dynamic Greeks management.
Disclaimer: The content of this article does not constitute a recommendation or investment advice for any financial products.

Email Subscription
Subscribe to our email service to receive the latest updates
