200-Day MA Test: Support or Breakdown?
![]() FoolBull
FoolBull
04:45 June 6, 2025 EDT
The 200-day moving average (MA) is a widely followed technical indicator on Wall Street, primarily used to identify long-term market trends.
When prices consistently trade above the 200-day MA, it often signals a “positive feedback loop”: institutional allocation flows, retail
momentum, and corporate earnings growth reinforce each other, creating a self-sustaining bull market trend.
From a behavioral finance perspective, the support and resistance functions of the 200-day MA reflect the collective beliefs of market
participants. As prices approach this average, a confluence of algorithmic stop-loss triggers, hedge fund risk management models, and retail
investor sentiment tends to drive market behavior, resulting in a “self-fulfilling prophecy.”
In a bull market environment, a pullback toward the 200-day MA is a normal occurrence. It helps correct overbought conditions and
reinforces technical support. Therefore, a decline to this level does not necessarily indicate market weakness; the key lies in whether the
price can hold above this threshold.
The Market Now
As of the close on June 5, 2025, the S&P 500 Index stood at 5,939.30, trading 2.45% above its 200-day simple moving average (5,794) and
4.5% above its exponential moving average (5,683).
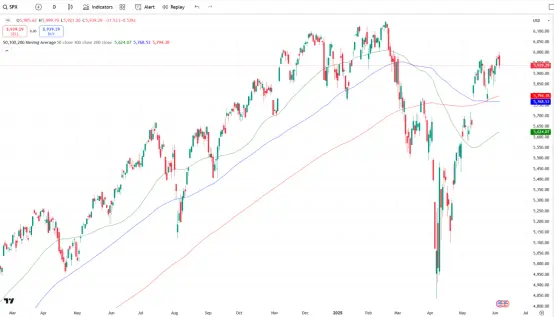
Source: TradingView
Source: TradingView
This buffer zone provides both a margin of safety and room for a potential technical pullback.
Notably, in April 2025, the S&P 500 triggered a “death cross” — when the 50-day moving average crosses below the 200-day moving
average — a signal typically viewed as a warning of short-term downside risk. However, the index did not experience sustained weakness
and subsequently rebounded. The failure of this signal to materialize indicates that the market’s technical structure remains intact.
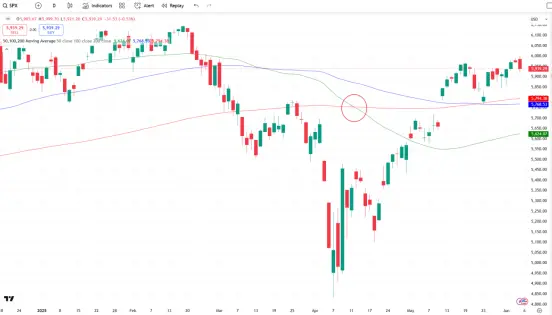
Source: TradingView
Historical data show that since 1950, following a “death cross,” the S&P 500 has posted gains over the next 30 days 60% of the time, with
an average return of 0.8%. This pattern reflects investors’ continued confidence in the longer-term trend and their ability to digest short-
term volatility rationally.
Performance History
Pullbacks are a normal feature of market behavior. Historical data show that in approximately half of all years, markets experience at least
one correction of 10% or more, with the average drawdown around 15%. In bull markets, the 200-day moving average has historically acted
as a key level of support. Below are a few notable examples:
In August 2011, the S&P 500 broke below its 200-day moving average amid peak investor panic. However, the index rebounded and gained
29% over the following 12 months.
In March 2020, the market plunged more than 35%, falling well below the 200-day moving average. The trend was swiftly reversed by the
Federal Reserve’s unlimited quantitative easing and expectations of economic reopening, eventually reclaiming the moving average level.
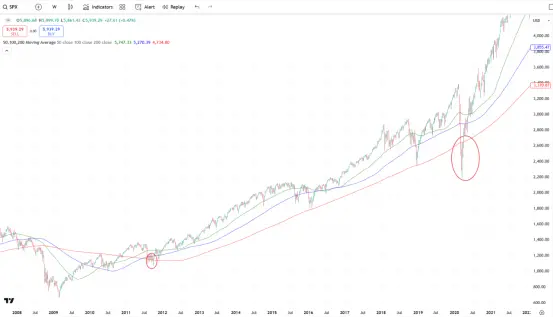
Source: TradingView
Historical data suggest that in the context of a mature bull market, the 200-day moving average holds with a success rate of up to 70%.
While short-term bearish signals are often absorbed by the broader long-term trend, a decisive break below this level frequently marks a
fundamental shift in market direction.
Market Risk Signals
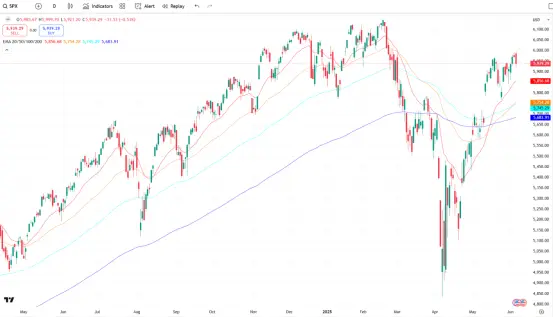
Beyond the major indices, market breadth—a key indicator of overall market health—also reflects the extent and participation of the broader
rally. Currently, approximately 60% of S&P 500 constituents are trading above their respective 200-day moving averages. This mid-range
level indicates that the market remains resilient overall, but some degree of internal divergence is emerging.
Historically, the interpretation of market breadth by percentage above the 200-day moving average is as follows:
Above 70%: Indicates broad-based bullish momentum, high participation across sectors, and strong risk appetite.
Between 50% and 70%: Suggests internal market divergence, with weakness in select sectors and rising caution warranted.
Below 50%: Typically reflects a bearish trend or a deep correction phase, with elevated risk across the market.
The current 60% level suggests that a majority of stocks are still maintaining support above their long-term trend lines, though a growing
number are showing signs of pullback. This aligns with the broader market potentially retesting its 200-day moving average in the coming
weeks.
Whether the market can successfully hold above this key technical level will be critical in determining the continuation of the prevailing
trend. Several signals warrant close attention as potential warnings:
Repeated failures to hold the 200-day moving average, indicating weakening support.
Ongoing downward revisions in earnings expectations, undermining bullish momentum.
Rising correlations across asset classes, potentially signaling elevated systemic risk.
Increasing dispersion within sectors, particularly in technology and consumer discretionary, where leadership is becoming more
fragmented.
Taken together, these factors suggest the market is at a pivotal juncture, with elevated short-term volatility likely.
Fundamental Picture
Strong technical signals need to be supported by solid fundamentals. For now, earnings performance has been relatively healthy—S&P 500
companies overall exceeded expectations for the first quarter of 2025. However, growth momentum appears to be softening. Yardeni
Research recently revised its 2025 S&P 500 earnings per share (EPS) forecast down from $275 to $260.
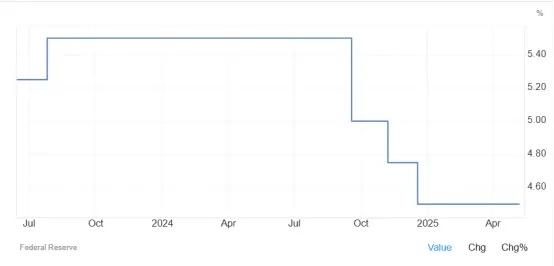
The Federal Reserve continues to maintain a relatively high interest rate environment, with the current target range at 4.25% to 4.5%. While
less restrictive than in 2022, rates remain well above pre-pandemic levels, putting valuation pressure on growth-oriented stocks.
Source: TradingView
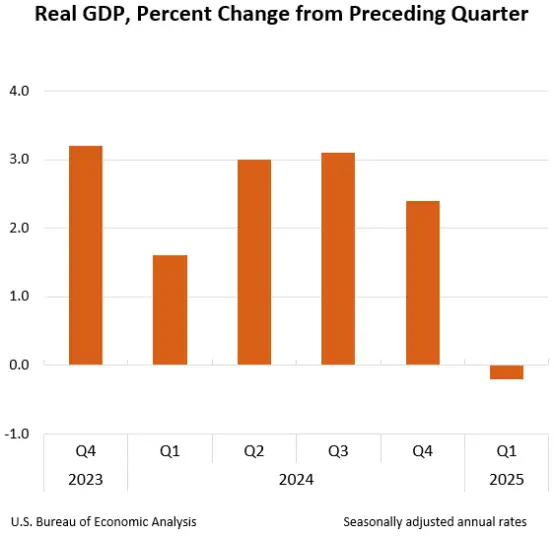
Expectations for economic growth have also weakened. According to data from the Bureau of Economic Analysis (BEA), U.S. GDP
contracted at an annualized rate of -0.3% in Q1 2025, down from 2.4% growth in the previous quarter and below the consensus estimate
of +0.3%.
Source: BEA
Valuation-wise, the S&P 500 currently trades at approximately 21 times forward earnings, significantly above the historical median of 17x. If
earnings expectations continue to be revised downward, the elevated valuation may increase the pressure for a mean reversion toward
historical norms.
That said, market sentiment remains broadly optimistic. According to MarketWatch, major Wall Street banks and brokerage firms generally
forecast further upside for the S&P 500 through the end of 2025. Among the most bullish is Deutsche Bank, which expects the index to
reach 7,000—implying a 16.7% gain from current levels.
Disclaimer: The content of this article does not constitute a recommendation or investment advice for any financial products.

Email Subscription
Subscribe to our email service to receive the latest updates
