U.S. Stocks See a 'Black Friday': Will April's Market Plunge Repeat?
![]() FoolBull
FoolBull
22:27 October 10, 2025 EDT
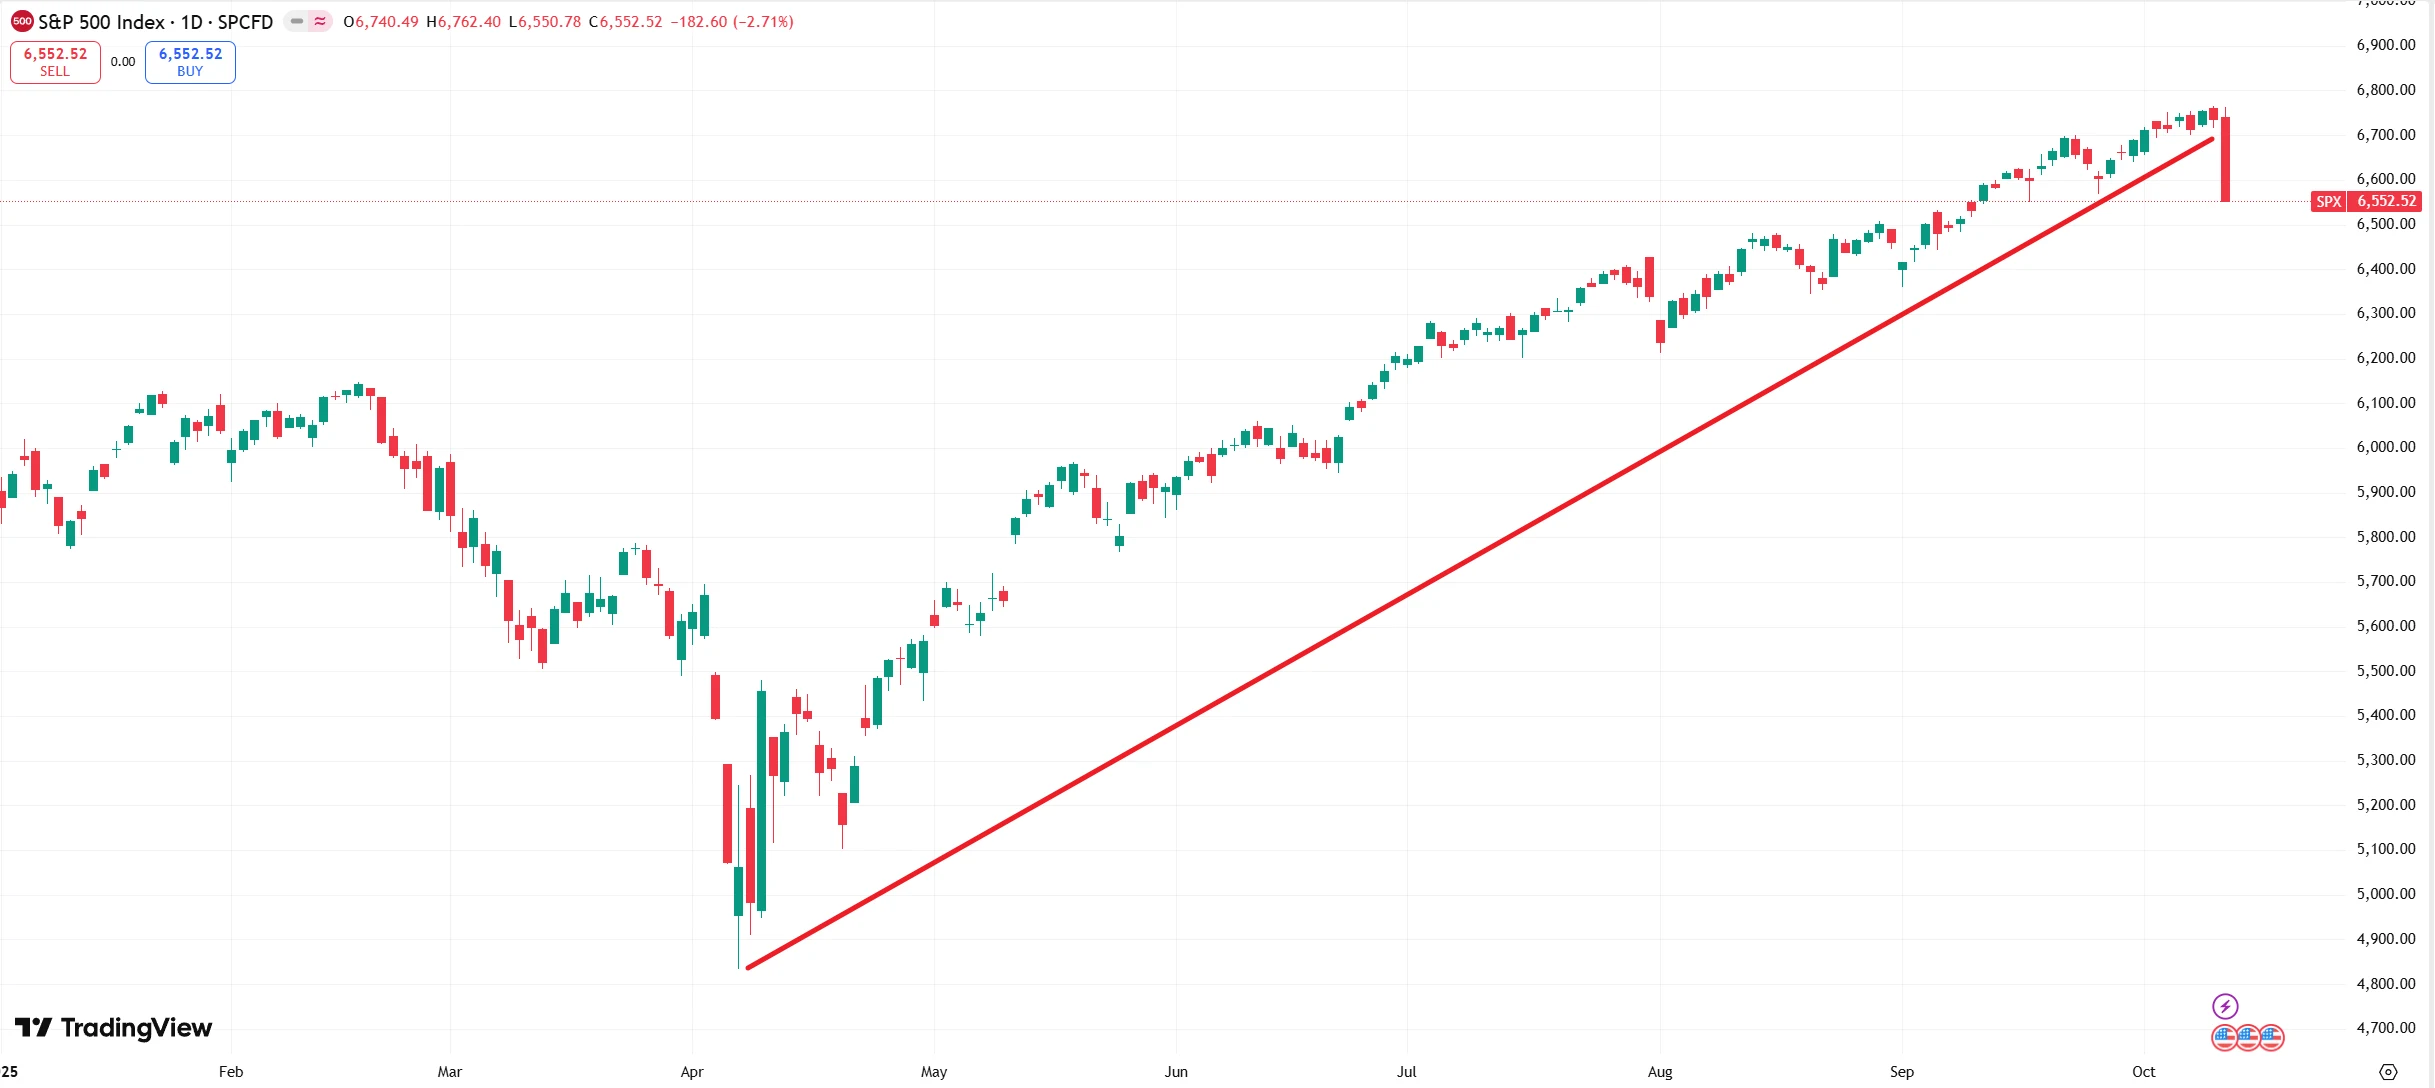
On October 10 (ET), U.S. stocks were hit by a sudden and sharp sell-off. The three major U.S. indices opened higher but plunged abruptly during midday trading, with losses deepening throughout the afternoon. By the close, all major benchmarks had posted their steepest single-day declines since April.
At the closing bell, the Dow Jones Industrial Average dropped 878.82 points, or 1.90%, to 45,479.60. The S&P 500 fell 182.60 points, or 2.71%, to 6,552.51, while the Nasdaq Composite led the losses, tumbling 820.20 points, or 3.56%, to 22,204.43.
Source: TradingView
The abrupt plunge cast a shadow over the market’s steady rally since spring and reminded Wall Street traders of the turbulence seen in early April.
Causes of the Plunge
The White House’s threat to impose steep new tariffs on China became the spark that triggered widespread market panic.
On Friday, October 10 (local time), U.S. President Donald Trump posted a hardline message on social media, warning that he would impose “massively increased tariffs” on Chinese goods. A day earlier, China’s Ministry of Commerce and General Administration of Customs announced a series of export control measures targeting rare earth–related materials. According to the statement, foreign entities and individuals must obtain a dual-use export license from the Ministry of Commerce before exporting certain rare earth items from China to other countries or regions.
The news sent Wall Street traders rushing to hit the sell button, as fears of an escalating trade war swiftly outweighed the market’s earlier optimism.
The escalating U.S. government shutdown further heightened market anxiety. As the shutdown entered its 10th day, the Trump administration began implementing large-scale permanent layoffs of federal employees — a break from precedent in modern U.S. history. Meanwhile, partisan divisions over a temporary funding bill continued to deepen, with the Senate’s seventh vote on the measure ending in failure, dimming hopes for a near-term resolution.
On the macro front, preliminary data showed the University of Michigan’s consumer sentiment index fell to 55 in October, its lowest level since May.
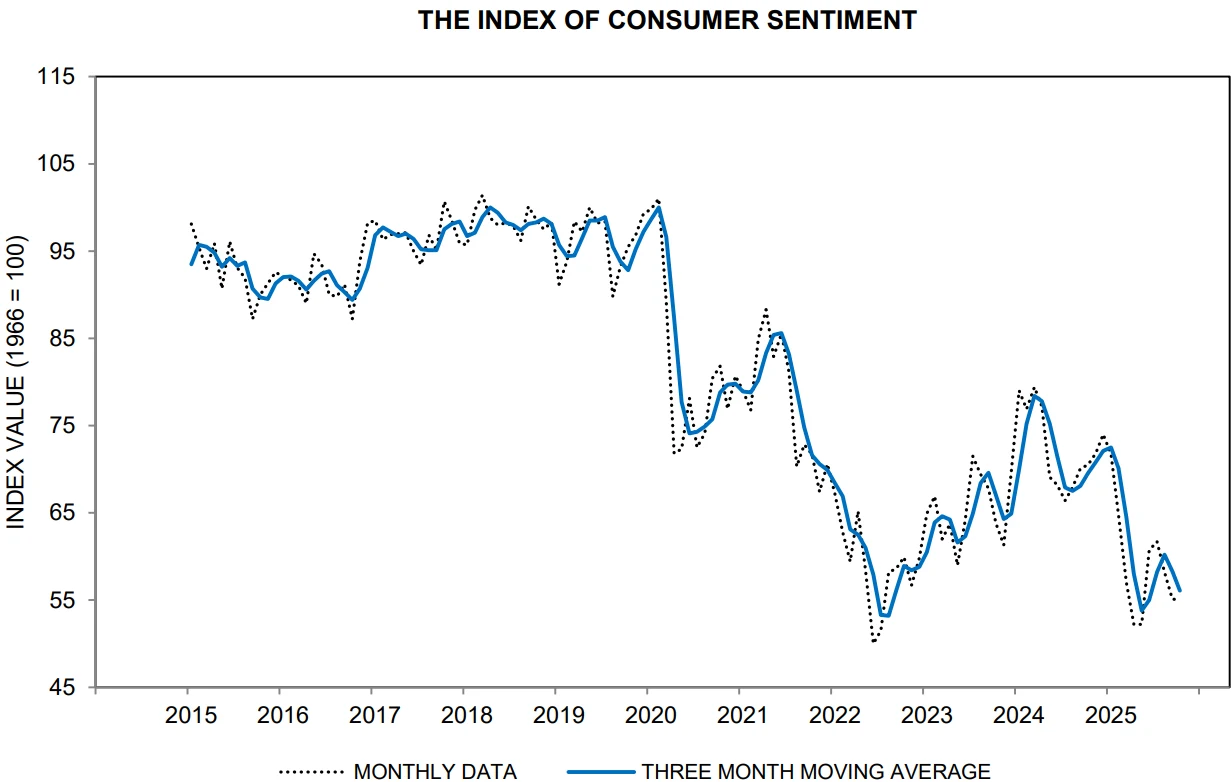
Source: University of Michigan
Consumers now expect prices to rise at an annual rate of 4.6% over the next year and 3.7% over the next five to ten years. About 63% of respondents said they anticipate the unemployment rate will climb next year, while more than two-thirds expect inflation to outpace their income growth.
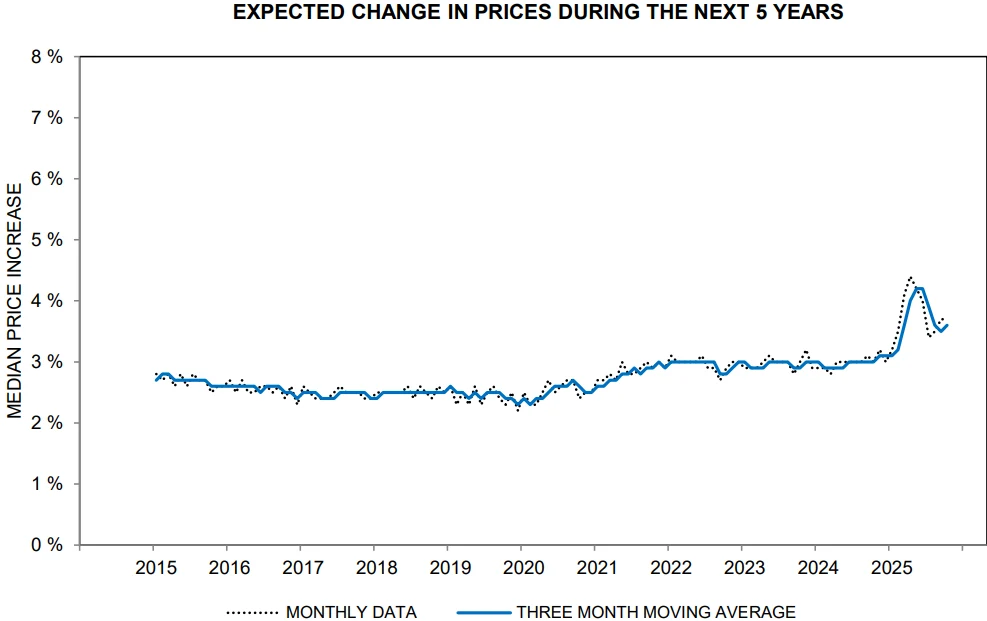
Source: University of Michigan
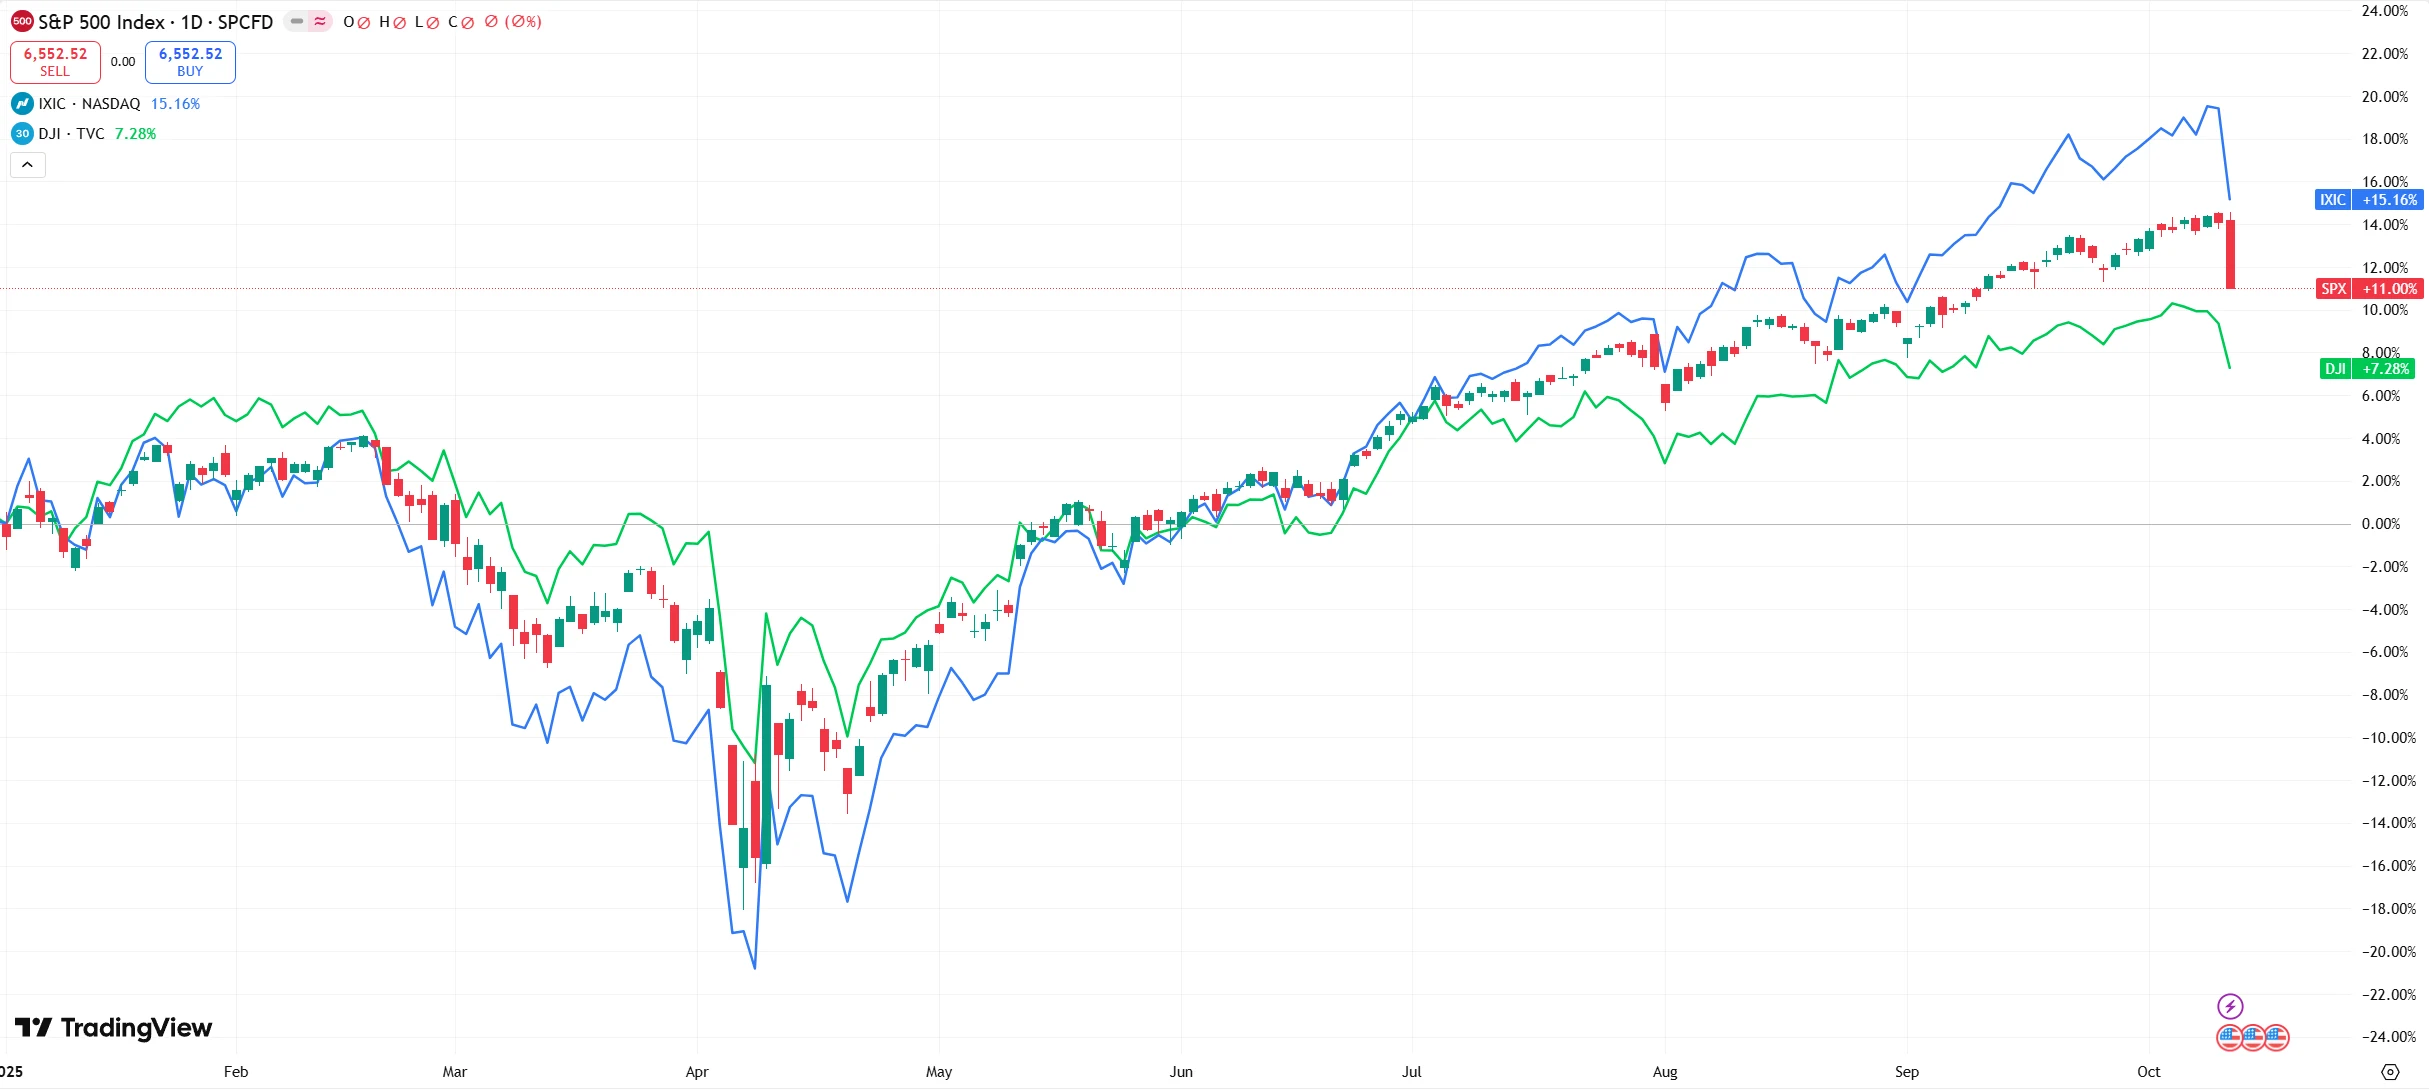
From a technical perspective, the market correction was also a natural pullback following a prolonged rally. Since the April lows, U.S. equities had been on a strong upward trend, with the S&P 500 posting five consecutive months of gains and going 100 trading days without a single session move of more than 2%. The extended advance had built up significant profit-taking pressure — the S&P 500 had surged more than 28% from its April trough to its October peak, while the “Magnificent Seven” tech stocks each climbed over 40%. Against the backdrop of rare earth export tensions, renewed tariff threats, and the government shutdown, heavy profit-taking intensified the selloff.
Source: TradingView
Volatility Rebounds
From a market structure perspective, the selloff was characterized by growth stocks leading the decline while value stocks showed relative resilience. Beyond the technology and semiconductor sectors, industries sensitive to the rare earth supply chain—such as aerospace and electric vehicles—recorded the steepest losses, reflecting investors’ direct concerns over the potential impact of export controls. Meanwhile, defensive sectors like utilities fell less than 1%, signaling a rotation of funds toward lower-risk assets.
Volatility indicators surged but remained within a moderate range. The CBOE Volatility Index (VIX) spiked 31.83% on the day to 21.65, marking its first break above 21 in over two months. However, this level remains well below historical extremes—during the 2008 financial crisis, the VIX exceeded 89; it climbed above 85 at the onset of the COVID-19 pandemic in 2020; and during the April 2025 tariff turmoil, it briefly touched 50.
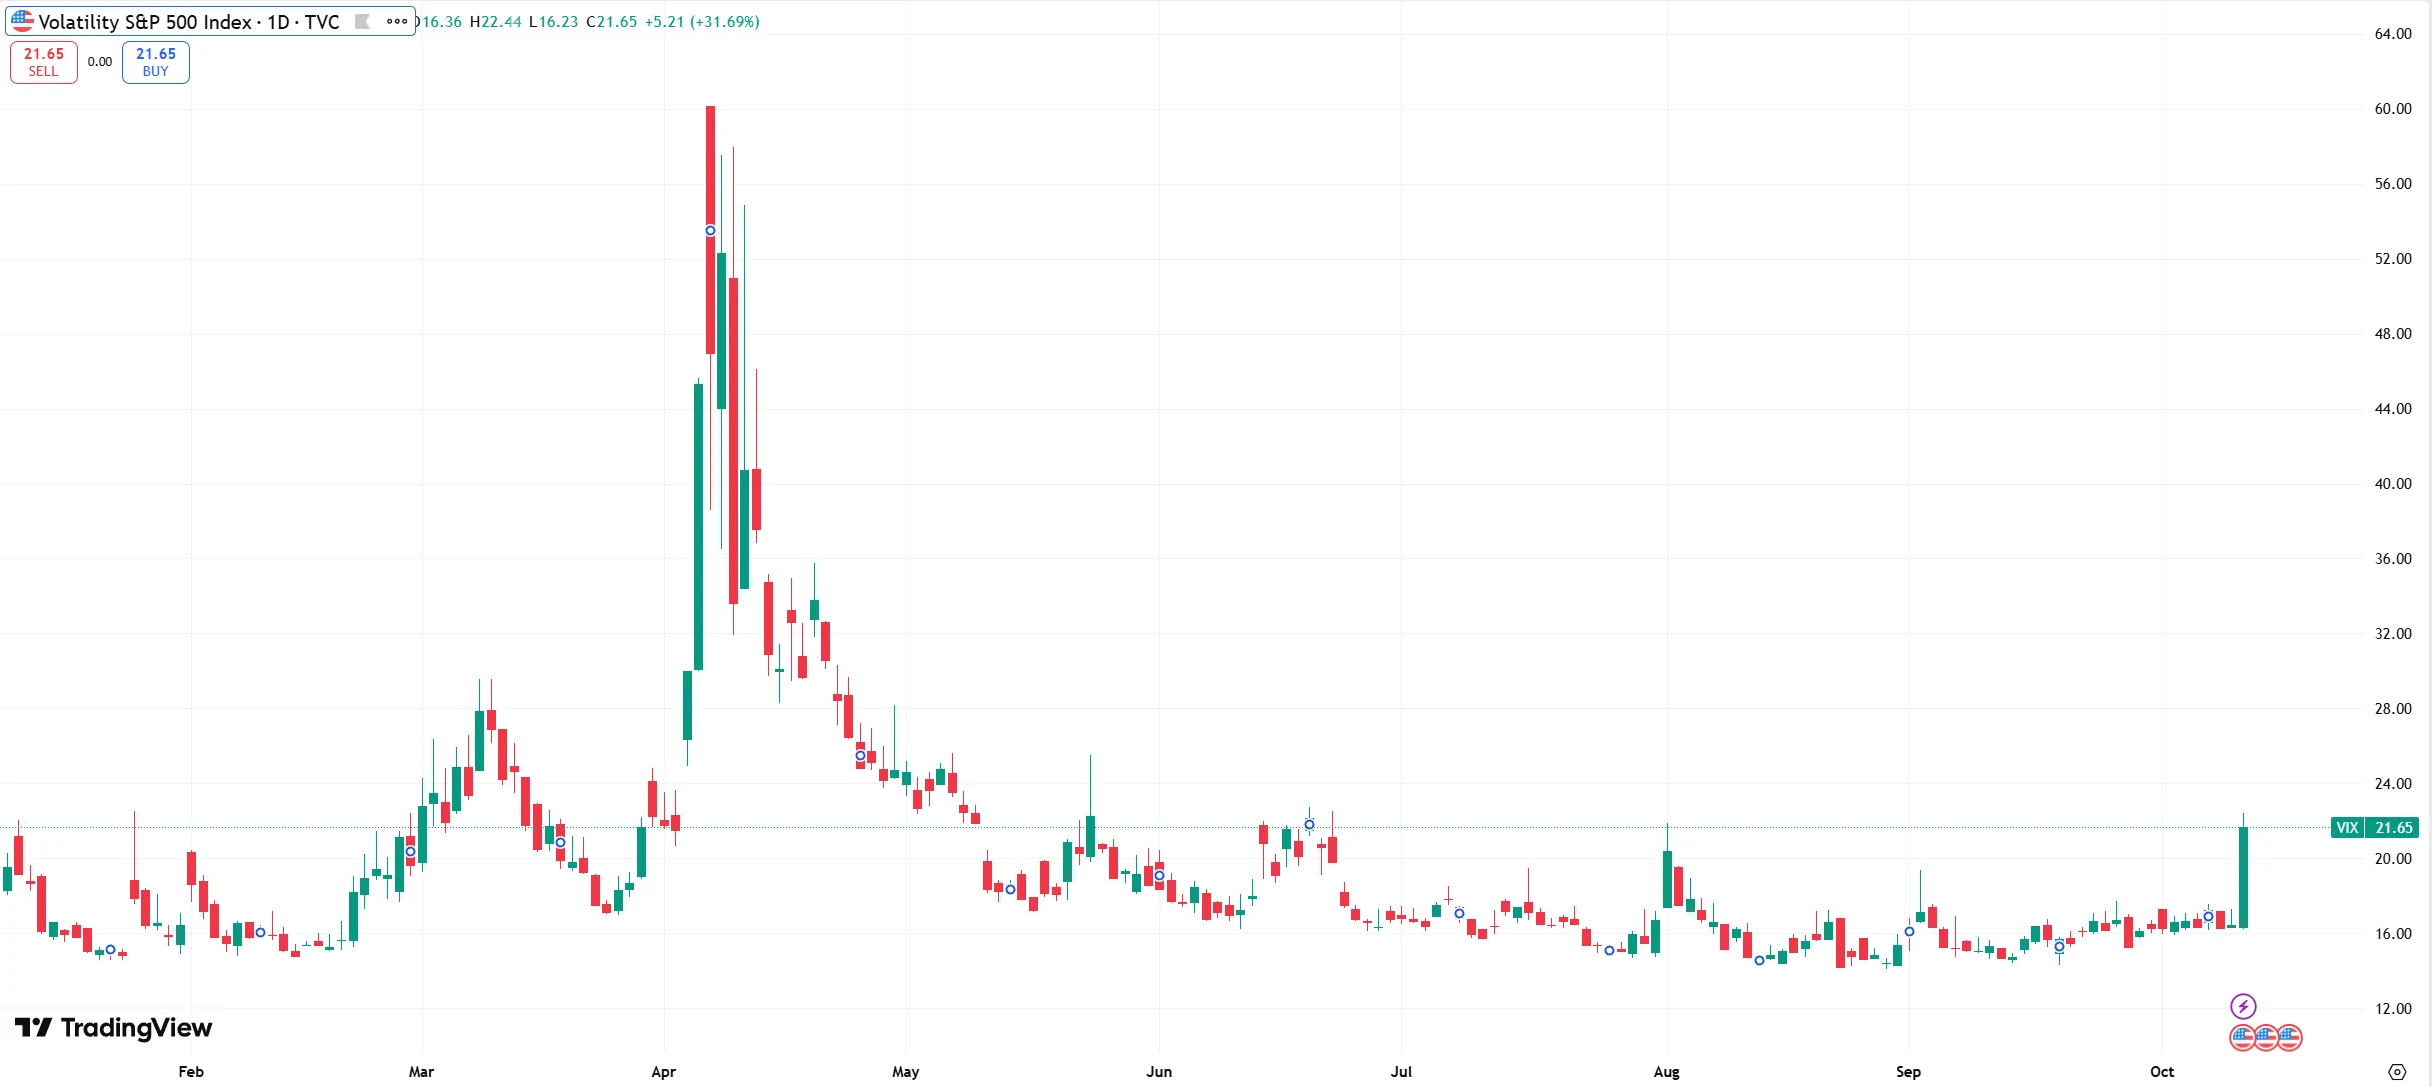
Source: TradingView
Mandy Xu, Head of Derivatives Market Intelligence at CME Group Global Markets, noted that a VIX reading around 21 is “not cause for concern,” describing it as a normal repricing driven by headlines rather than genuine panic.
Data from the derivatives market also suggests the adjustment was relatively orderly. According to Alex Kosoglyadov, Managing Director of Global Equity Derivatives at Nomura Holdings, there was no rush among clients to buy protective positions, and option market positioning remained relatively balanced. Market-makers’ exposures were better aligned compared with selloffs in April 2025 or August 2024, indicating stronger preparedness for rising volatility. This stability reflects improved institutional risk management in prior episodes of turbulence, which helped prevent a cascade of forced selling.
Cross-asset dynamics further indicated that the equity selloff did not trigger a broader liquidity crunch. The U.S. 10-year Treasury yield fell 2 basis points to 4.19%, signaling a modest flight to safety. Gold prices rose 0.91% to $4,017 per ounce, while the U.S. dollar index declined 0.56%, suggesting that risk aversion was largely contained within equities rather than spilling over into a systemic liquidity squeeze akin to 2008.
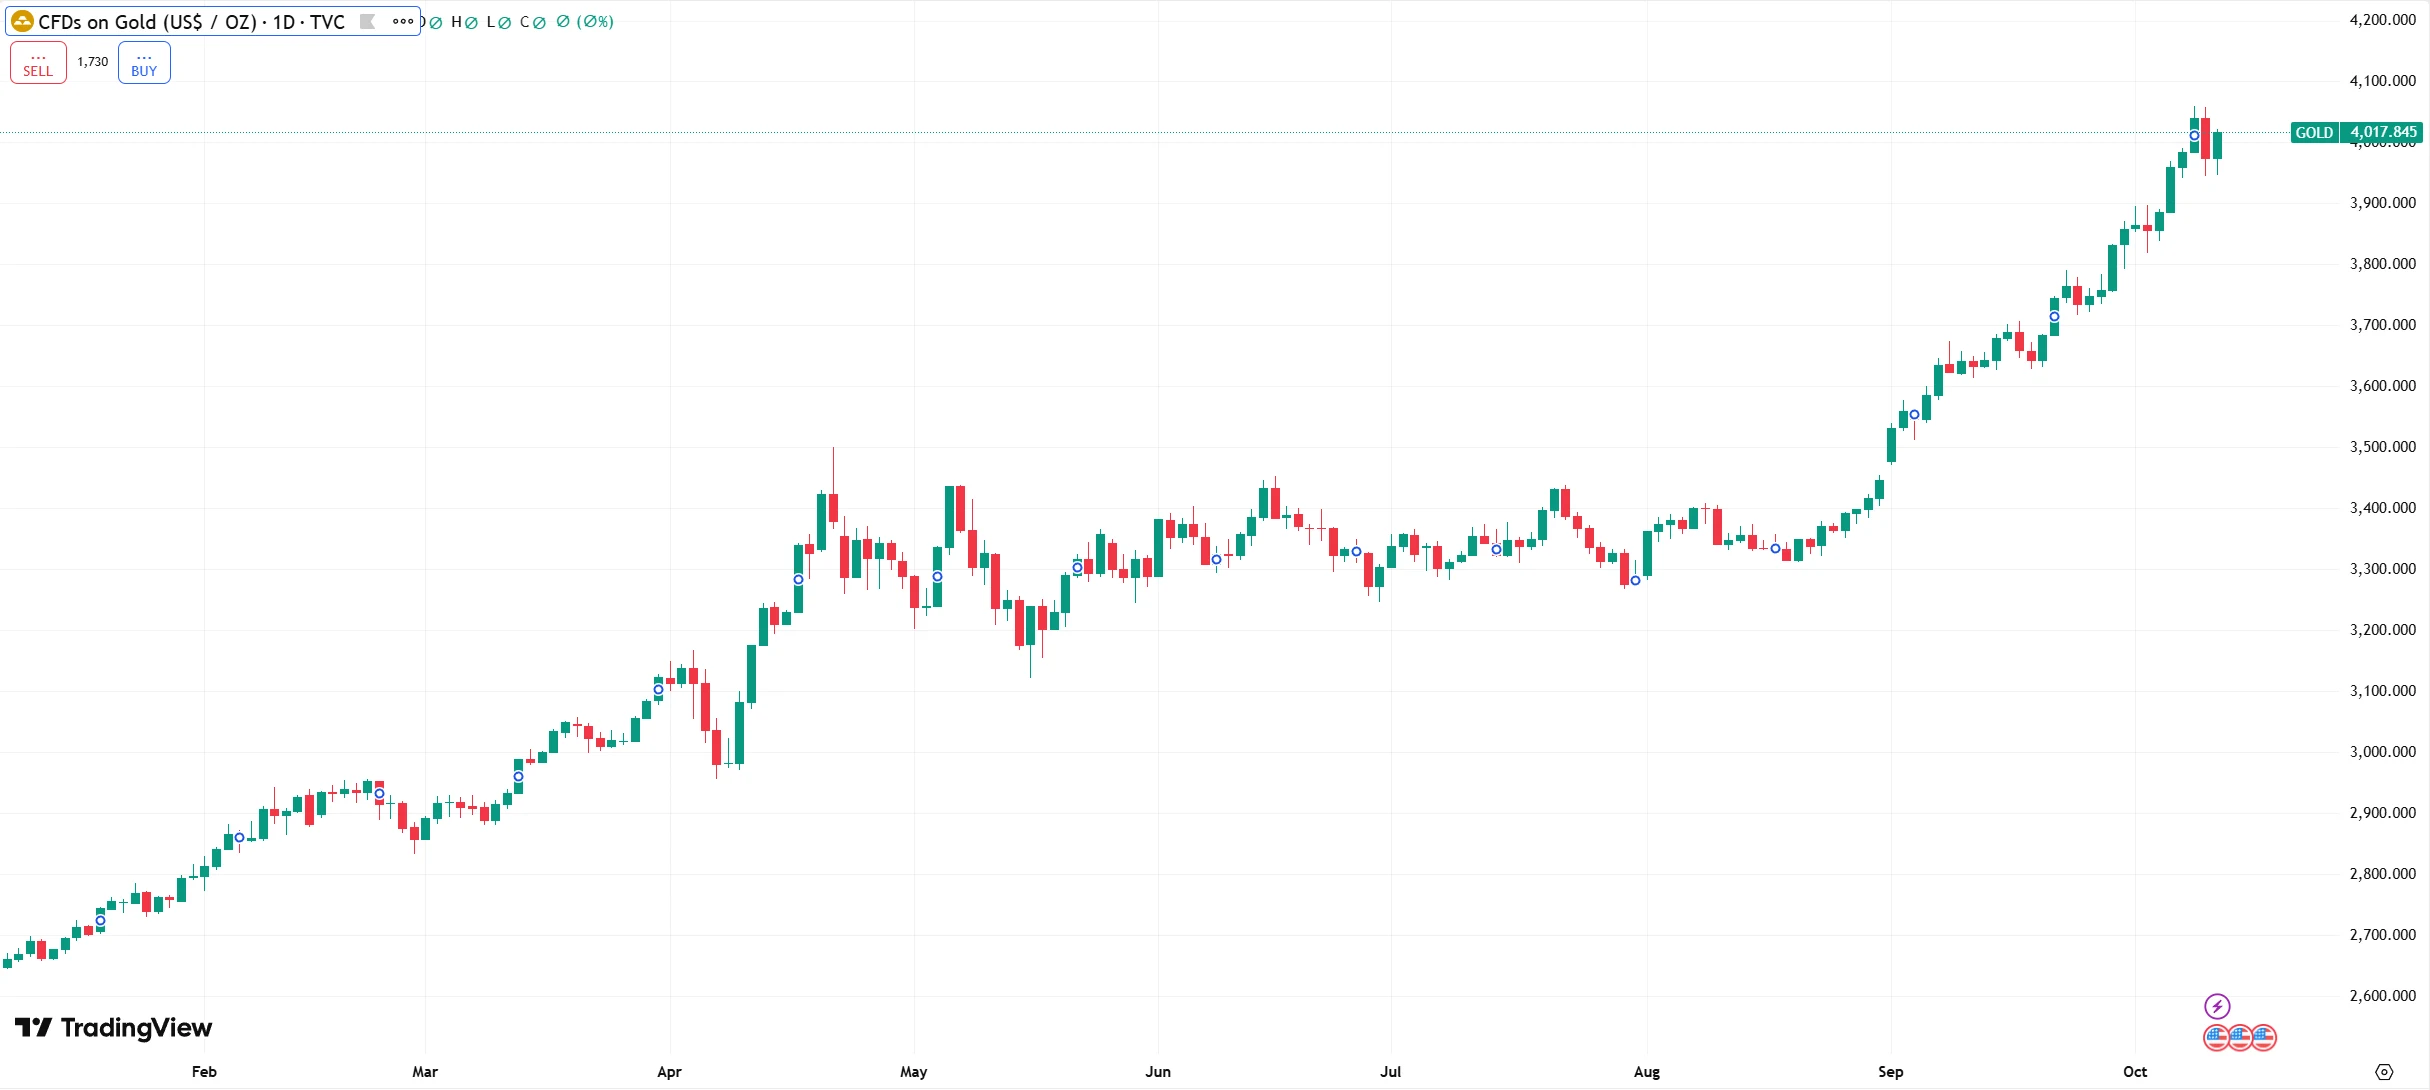
Source: TradingView
Bullish and Cautious Forecasts
Market opinions on the outlook for U.S. equities are now sharply divided.
Ashok Varadhan, Co-Head of Global Banking and Markets at Goldman Sachs, argued that the current bull market remains “high quality,” with U.S. stocks still representing the best investment opportunity. He noted that since the April tariff episode, market volatility has stayed relatively low, suggesting strong resilience to negative news. The key drivers supporting the rally—expectations of future Fed rate cuts, fiscal stimulus from the “America the Beautiful” Act, and the rise of artificial intelligence—remain intact.
Peter Oppenheimer, Goldman Sachs’ Chief Global Equity Strategist, added that while current valuations and the dominance of a few large-cap stocks resemble previous bubbles, the fundamental difference lies in the fact that today’s tech giants have solid earnings power. Data shows the S&P 500 is trading at roughly 23 times earnings—above the 10-year average of 18.7 but below the 25 times recorded during the 2000 dot-com bubble. The tech sector’s price-to-earnings ratio stands at about 30, far below the 48 peak during that era. Moreover, leading companies such as Apple and Microsoft maintain net profit margins above 20%, a stark contrast to the unprofitable startups of two decades ago.
However, The Wall Street Journal highlighted that the S&P 500’s price-to-sales ratio has climbed to a record 3.23, implying investors are paying an unprecedented premium for each dollar of revenue. According to Morningstar, the “Magnificent Seven” now account for 34% of the S&P 500’s total market capitalization, and the ten largest companies collectively represent nearly 40%—well above the 23% concentration seen during the dot-com bubble. Such dominance means that a correction in a single sector could trigger significant index-level volatility.
Policy risks have also come under scrutiny. Morgan Stanley warned that the dual pressures of rare earth export controls and escalating tariff threats pose a “supply chain–trade” risk that could weigh on corporate earnings for an extended period. At the same time, divisions within the Federal Reserve over the appropriate neutral rate could lead to policy missteps, amplifying market volatility.
In addition, the “America the Beautiful” Act—viewed by Goldman Sachs as a fiscal positive—has begun to show potential downsides. The Congressional Budget Office (CBO) estimates the legislation could leave 10 million people without health insurance, cut $1 trillion in healthcare spending over the next decade, and further widen the fiscal deficit. Former Treasury Secretary Larry Summers has warned that such dynamics could create a vicious cycle of “rising deficits, higher interest rates, and slower growth.”
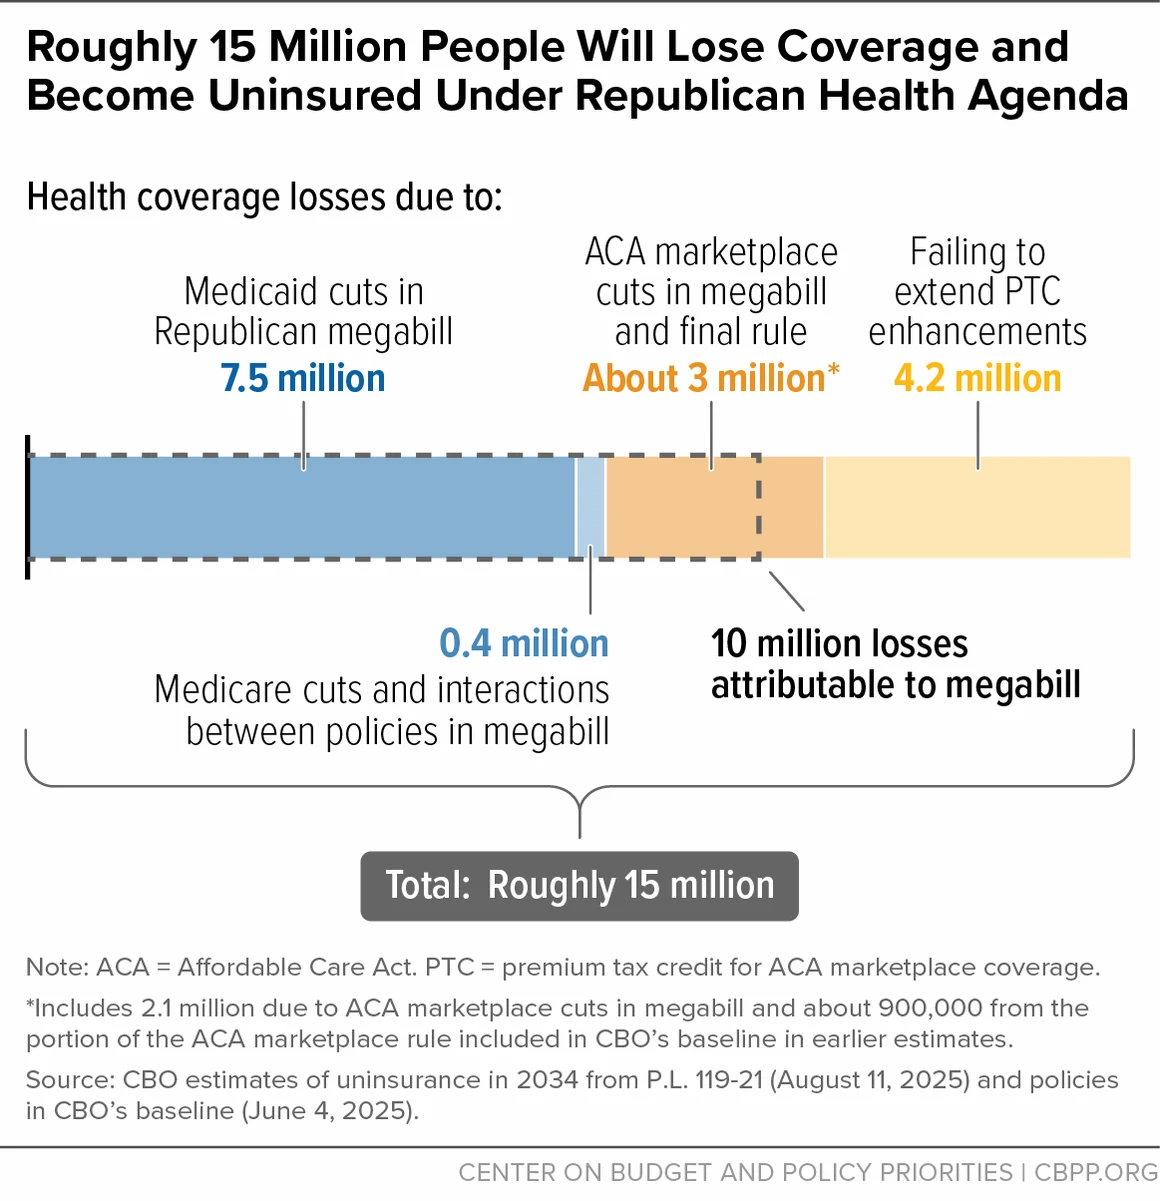
Source: Congressional Budget Office
Conclusion
The U.S. stock market’s sharp selloff came both suddenly and forcefully. The VIX volatility index surged more than 31%, clearly reflecting a rapid shift in market sentiment. As the S&P 500 repeatedly hit new highs and valuations approached levels last seen during the dot-com bubble, warnings about a potential U.S. equity bubble have grown increasingly frequent.
After months of steady gains since April and substantial profit-taking buildup, the latest plunge serves as a stark reminder to investors: every market rally, no matter how exuberant, carries with it moments of chilling reality.
Disclaimer: The content of this article does not constitute a recommendation or investment advice for any financial products.

Email Subscription
Subscribe to our email service to receive the latest updates
