Will the U.S. Dollar Continue to Decline?
![]() FoolBull
FoolBull
05:37 October 9, 2025 EDT
Key Points:
In the first half of 2025, the US Dollar Index (DXY) recorded its sharpest semiannual decline since 1973, as factors that once underpinned dollar strength—economic growth advantages, interest rate differentials, and policy stability—are weakening.
The dollar remains the core of the global financial system, but its “absolute dominance” as a reserve currency is diminishing. Central banks’ asset diversification strategies and the expansion of non-dollar settlements are gradually reshaping the currency landscape, eroding the dollar’s demand base over the long term.
From a time horizon perspective, the dollar is expected to face gradual depreciation over the next 3–5 years. This does not imply an imminent loss of its global reserve currency status, but a slow restructuring of the international monetary system may accompany this process.
In the first half of 2025, the US Dollar Index (DXY) experienced its most pronounced semiannual drop since 1973, falling from 110.18 in January to 96.76 by the end of June, a cumulative decline of 12.18%, officially ending the 14-year bull market from 2010 to 2024. During that period, the index had risen from 73.1 to 110.18, a cumulative gain of over 50%.
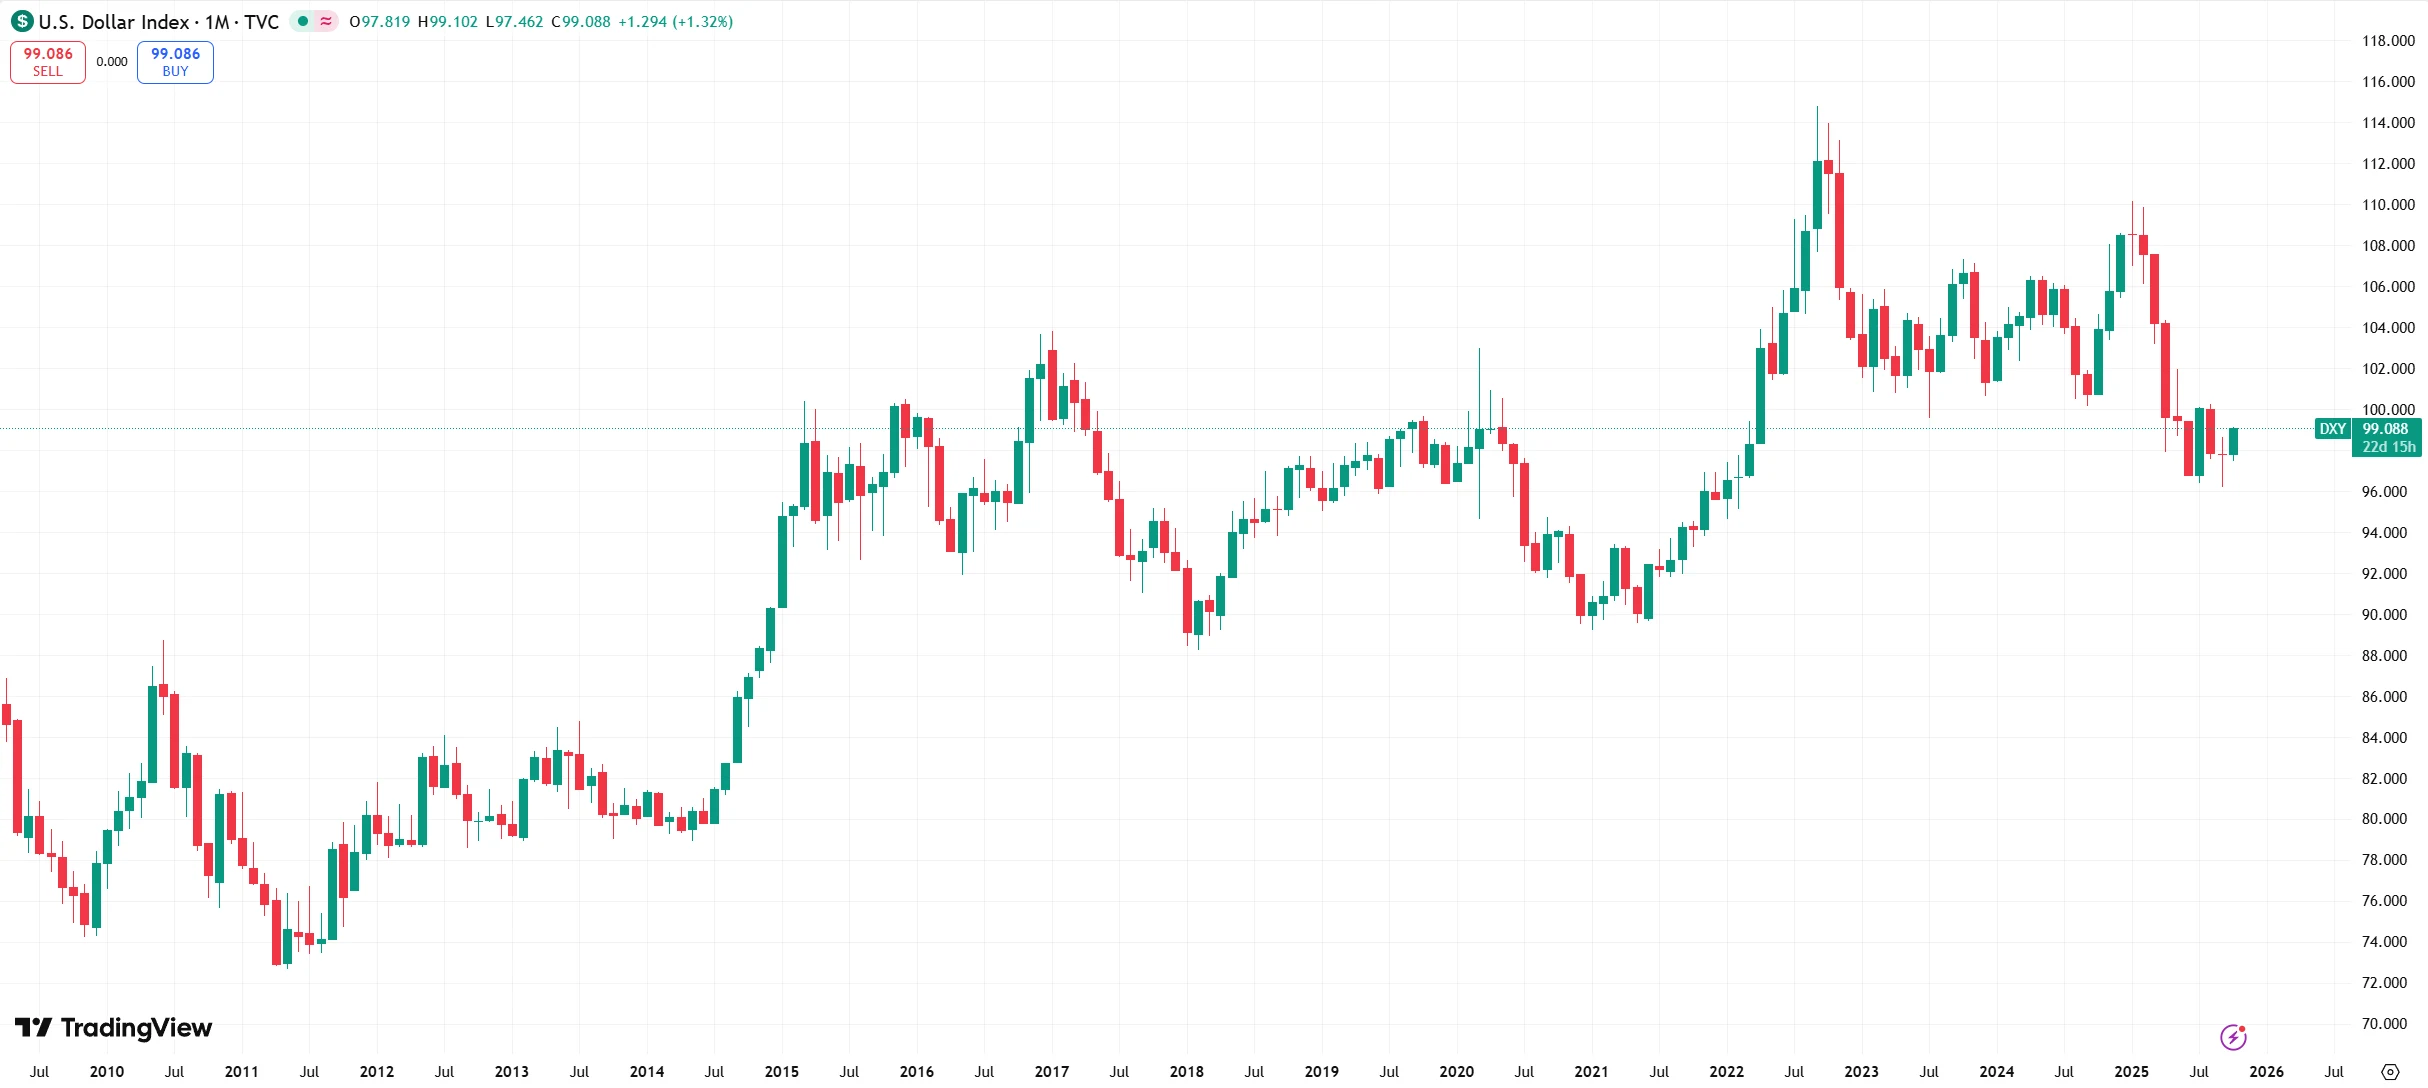
Source: TradingView
Since July, the dollar index has traded sideways in the 93–95 range, reflecting the market’s reassessment of the dollar’s fundamentals: the economic growth premium, interest rate differentials, and policy stability that once supported dollar strength are weakening, though resilience derived from its reserve currency status remains.
From a valuation perspective, the dollar remains historically overvalued. According to the Bank for International Settlements (BIS) real effective exchange rate index, the dollar’s real effective exchange rate in May 2025 was approximately 28% above its 2010 average. Among the 61 currencies tracked by BIS, only eight—including the Swiss franc and Norwegian krone—were valued higher than the dollar. Based on purchasing power parity (PPP) calculations, the dollar is still overvalued against the euro and the yen. This divergence between valuation and fundamentals indicates persistent long-term downside pressure on the dollar.
Internal Imbalances
The internal imbalances of the U.S. economy have become a core factor suppressing the dollar’s performance. These imbalances are primarily concentrated in three areas: widening fiscal deficits, rising debt levels, and surging interest expenditures. The absence of effective structural reform further exacerbates these risks.
In fiscal year 2025, the U.S. federal budget deficit reached $1.8 trillion, slightly down $3.3 billion from $1.833 trillion in FY2024, but still representing 5.9% of GDP—a historically high level. Outside of crisis periods or recessions, such a ratio is extremely rare in modern U.S. history.
Of particular concern is the rapid growth of the national debt. By the end of September 2025, the total U.S. Treasury debt exceeded $37.3 trillion, a more than 45% increase compared with the early months of the 2020 pandemic. Publicly held debt as a percentage of GDP rose to 119%, far above the IMF-recommended range of 60–80% for developed economies. The Congressional Budget Office (CBO), in its Long-Term Budget Outlook: 2025–2055, projects this ratio will reach 107% by 2029, surpassing the post-World War II peak of 106%, and is expected to continue rising over the long term.
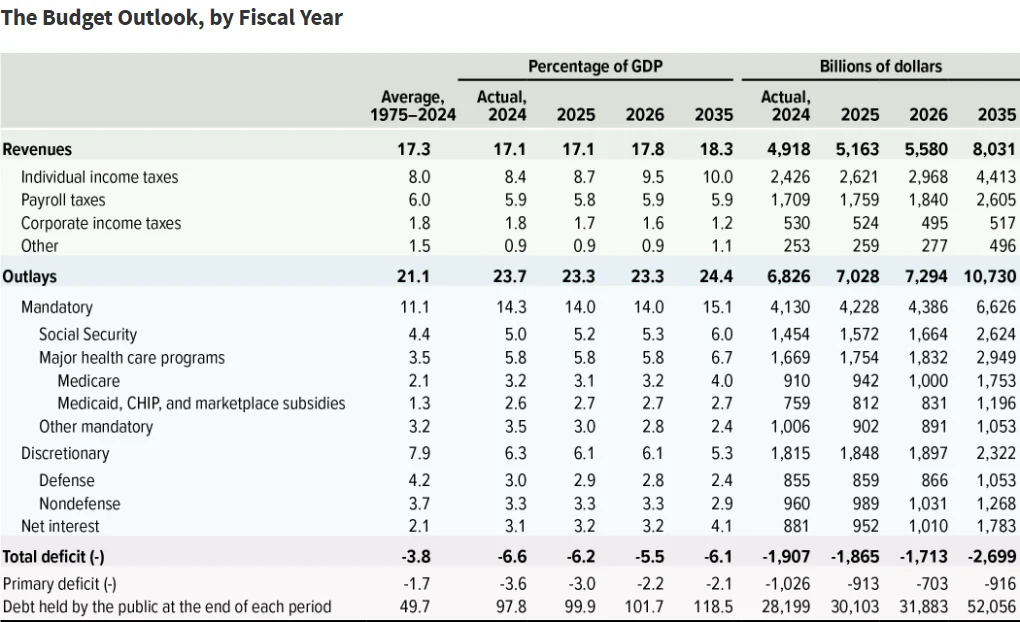
Source: CBO
Meanwhile, surging interest expenditures have become a “heavy burden” on fiscal balance. In FY2024, net interest payments on U.S. debt exceeded $1.1 trillion for the first time, up 29% from FY2023, surpassing the $780 billion military budget and accounting for 14% of total federal spending. Despite the Federal Reserve initiating rate cuts in 2025, the weighted average interest rate on existing debt remained at a high 3.32%, the highest level in the past 15 years. Interest payments for the full year 2025 are projected to exceed $952 billion, representing more than 3.3% of GDP—an 83% increase from 1.8% in 2019. Approximately 28% of newly issued debt is used to repay maturing principal and interest, up from 15% in 2010, consuming fiscal resources on non-productive expenditures and creating a cycle of “debt to service debt.”
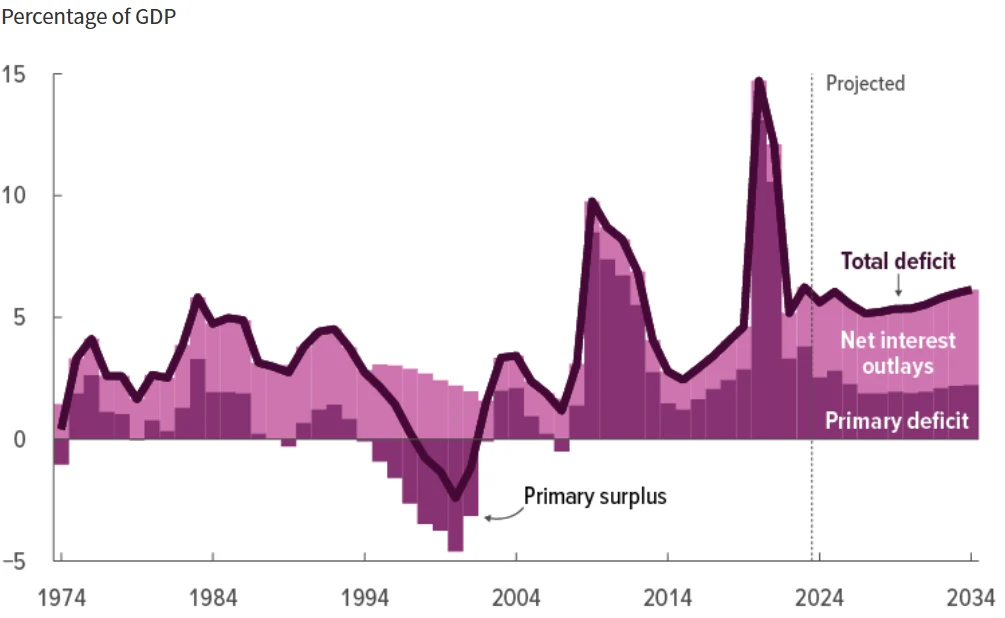
Source: CBO
Slower economic growth further intensifies fiscal pressures. In the first half of 2025, U.S. real GDP grew at an average annualized rate of 1.6%, with Q2 growth revised up to 3.8%, but roughly 50% of nominal growth came from inflation contributions.
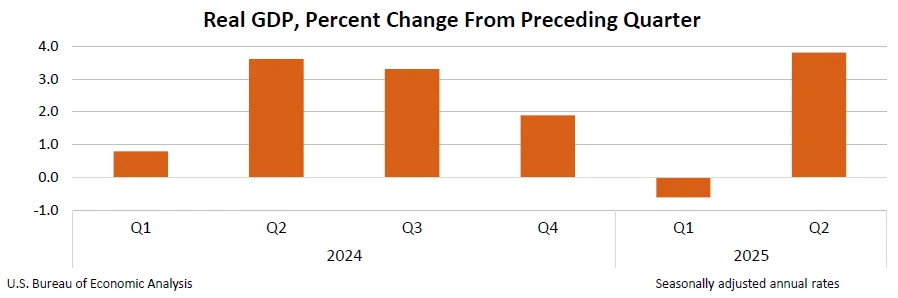
Source: BEA
Meanwhile, the core PCE price index rose at a 2.54% annualized rate in the first half of the year, with overall inflation climbing to 2.9% in August, clearly above the Fed’s 2% target.
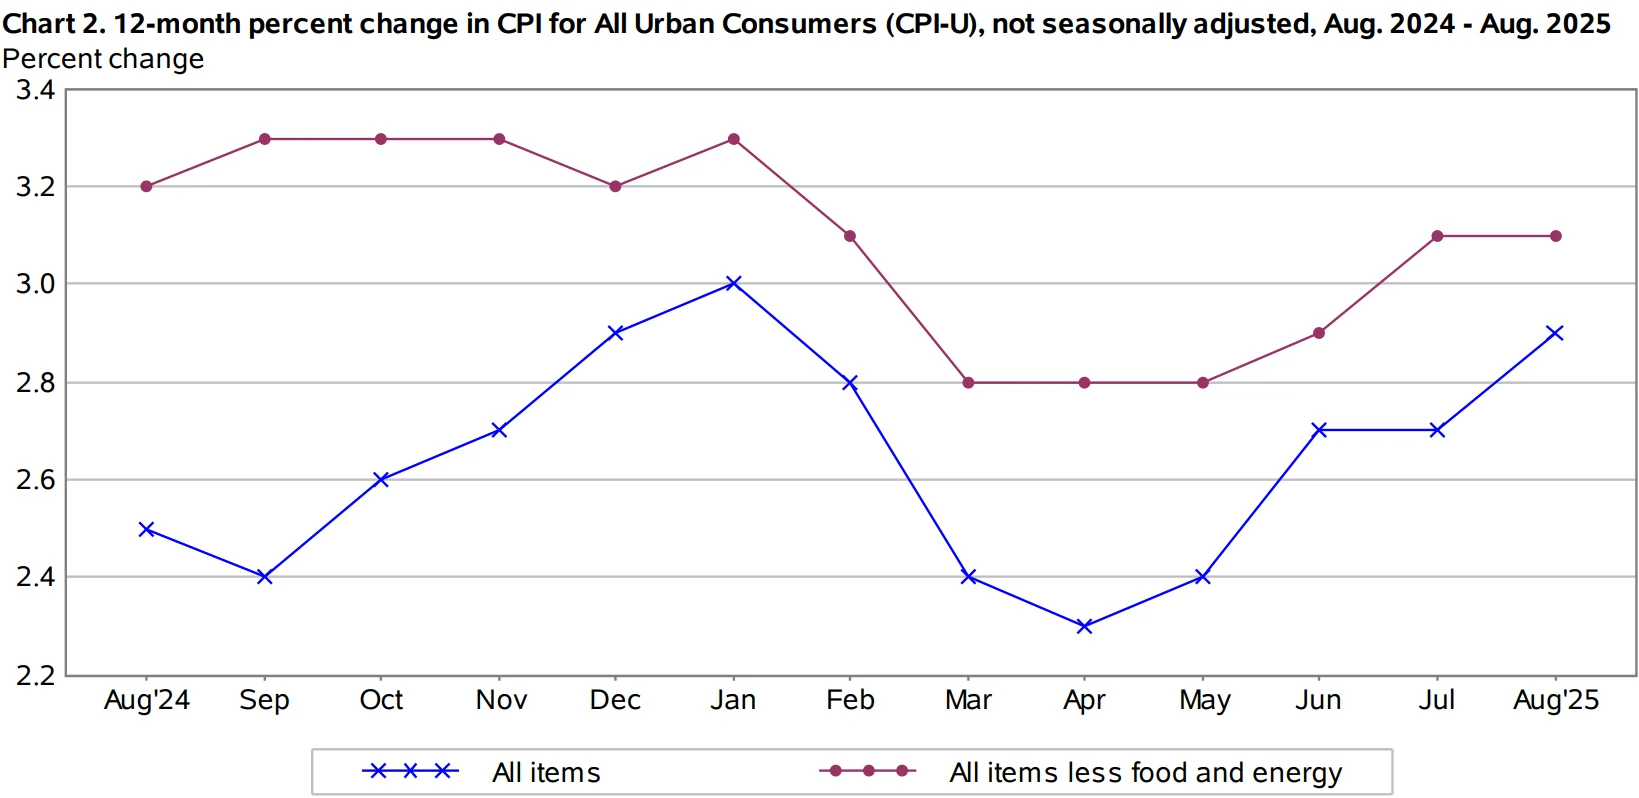
Source: U.S. Bureau of Labor Statistics
The CBO projects that between 2026 and 2030, U.S. real GDP growth will average just 1.7% annually, below the 2.3% average from 2010–2019. This implies that fiscal revenue growth may continue to lag behind spending expansion, with the deficit ratio remaining around 6% over the long term.
In the short term, household and corporate debt health provides some economic buffer. As of Q2 2025, the U.S. household debt service ratio (DSR) stood at 9.8%, below the long-term average of 10.2%; non-financial corporate debt default rates were 2.1%, near post-2008 lows. However, this short-term resilience is insufficient to offset the deterioration in fiscal fundamentals.
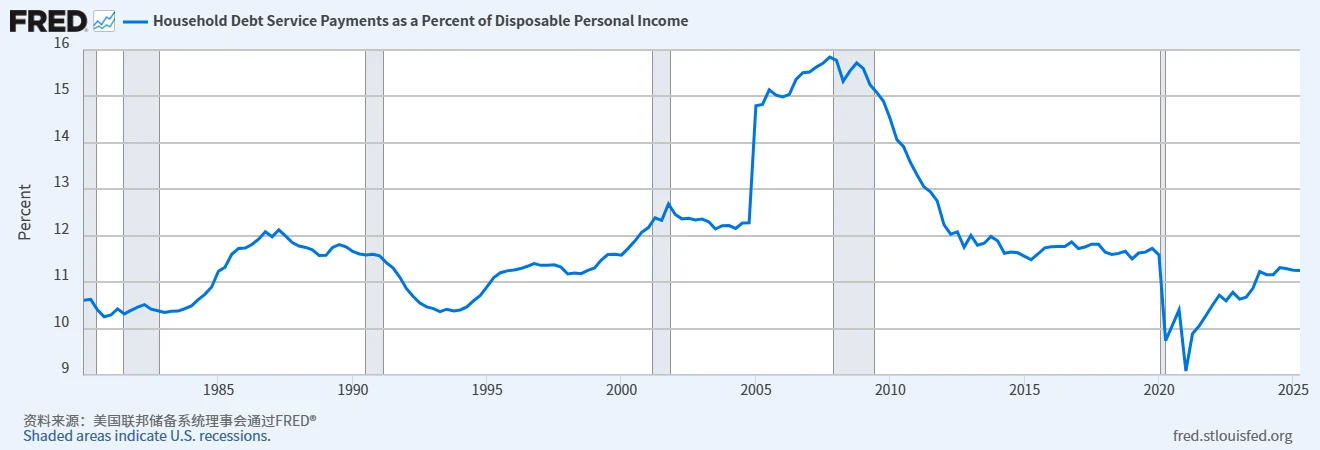
Source: FRED
Investor confidence in dollar-denominated assets has begun to waver. In Q2 2025, the average bid-to-cover ratio at U.S. Treasury auctions fell to 2.3x, down from 2.5x in 2023, reflecting that concerns about debt sustainability are beginning to translate into actual portfolio allocation adjustments.
External Pressures
The U.S.’s persistent current account deficits and high reliance on foreign capital constitute the dollar’s “external vulnerability.” This imbalance stems from low domestic savings, structural distortions in the economy, and is further pressured by the ongoing reshaping of global capital flows.
In 2024, the U.S. current account deficit widened to $1.12 trillion, up 13.5% from $987 billion in 2023, representing 3.7% of GDP—the highest level since the 2008 financial crisis. According to the IMF’s 2025 External Sector Report, the goods trade deficit remains the primary driver. In July 2025, the U.S. goods trade deficit reached $78.3 billion, up $19.2 billion from June’s $59.1 billion (revised).
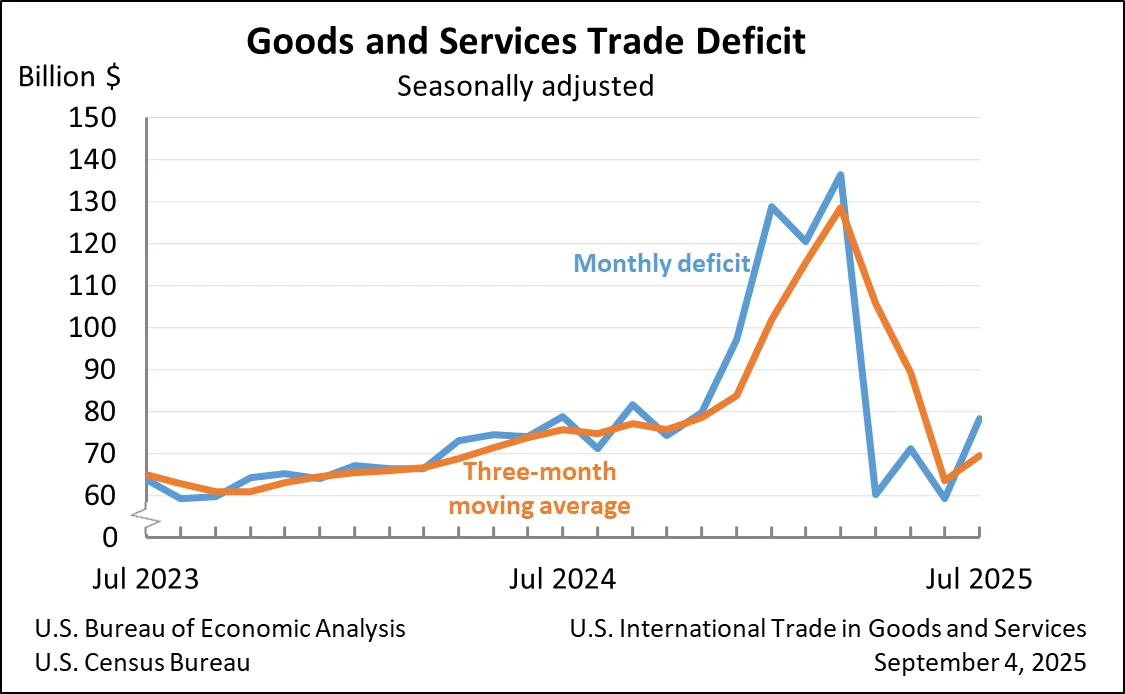
Source: BEA
This imbalance has made the U.S. heavily dependent on foreign capital inflows to “fill the gap.” By the end of 2024, foreign investors held $17.8 trillion in U.S. equities (19.6% of total market capitalization) and $8.8 trillion in U.S. Treasuries (31.4% of the marketable debt). However, capital inflows have become more uneven in 2025: in Q1, foreign investors net sold $23 billion of U.S. Treasuries—the first net outflow since Q3 2023. In Q2, while institutions like Vanguard and BlackRock increased holdings in tech stocks, total foreign equity positions in U.S. markets rose only 0.3% quarter-over-quarter, with Japanese and UK investors reducing holdings by 3% and 2.5% respectively, signaling waning confidence among some traditional holders.

Source: U.S. Department of the Treasury
The slowdown in capital inflows reflects the relative decline in the attractiveness of U.S. assets. In H1 2025, the S&P 500 rose 10.57%—positive but notably below the Euro Stoxx 50’s 15% and the Nikkei 225’s 18.2% gains—indicating a narrowing of relative return advantages for U.S. equities. Meanwhile, rising hedging costs associated with expected dollar depreciation have further dampened foreign investment. The one-year USD/EUR hedging cost rose to 2.1% in 2025, up 75% from 1.2% in 2023, reducing the hedged yield on U.S. Treasuries for foreign investors to 2.3%, below Germany’s unhedged yield of 2.5%.
From a balance-of-payments perspective, the U.S.’s net international investment position (NIIP) has reached negative $18.7 trillion, or 63.5% of GDP, meaning U.S. liabilities far exceed foreign assets. This necessitates annual net investment income payments of roughly $500 billion, adding further pressure to the current account.
This “debt-driven economic” model relies in the long term on the dollar’s reserve currency status. However, as global capital allocation becomes more diversified, this foundation is gradually eroding, exposing the dollar to persistent external depreciation pressure.
Erosion of Reserve Status
The U.S. dollar remains at the core of the global financial system, but its “absolute dominance” as the world’s reserve currency is gradually weakening. Central banks’ asset diversification strategies and the growing adoption of non-dollar settlements are slowly reshaping the global currency landscape, eroding the long-term demand base for the dollar.
Changes in the composition of global foreign exchange reserves most clearly illustrate this trend. In Q2 2025, the dollar’s share of official global reserves fell to 56.3%—the lowest level since the IMF began tracking this data in 1995—down 10 percentage points from 66.3% in 2015. According to the IMF, 92% of this decline reflects the dollar’s depreciation relative to other currencies, while the remaining 8% reflects active asset sales, signaling central banks’ ongoing “de-dollarization” efforts.
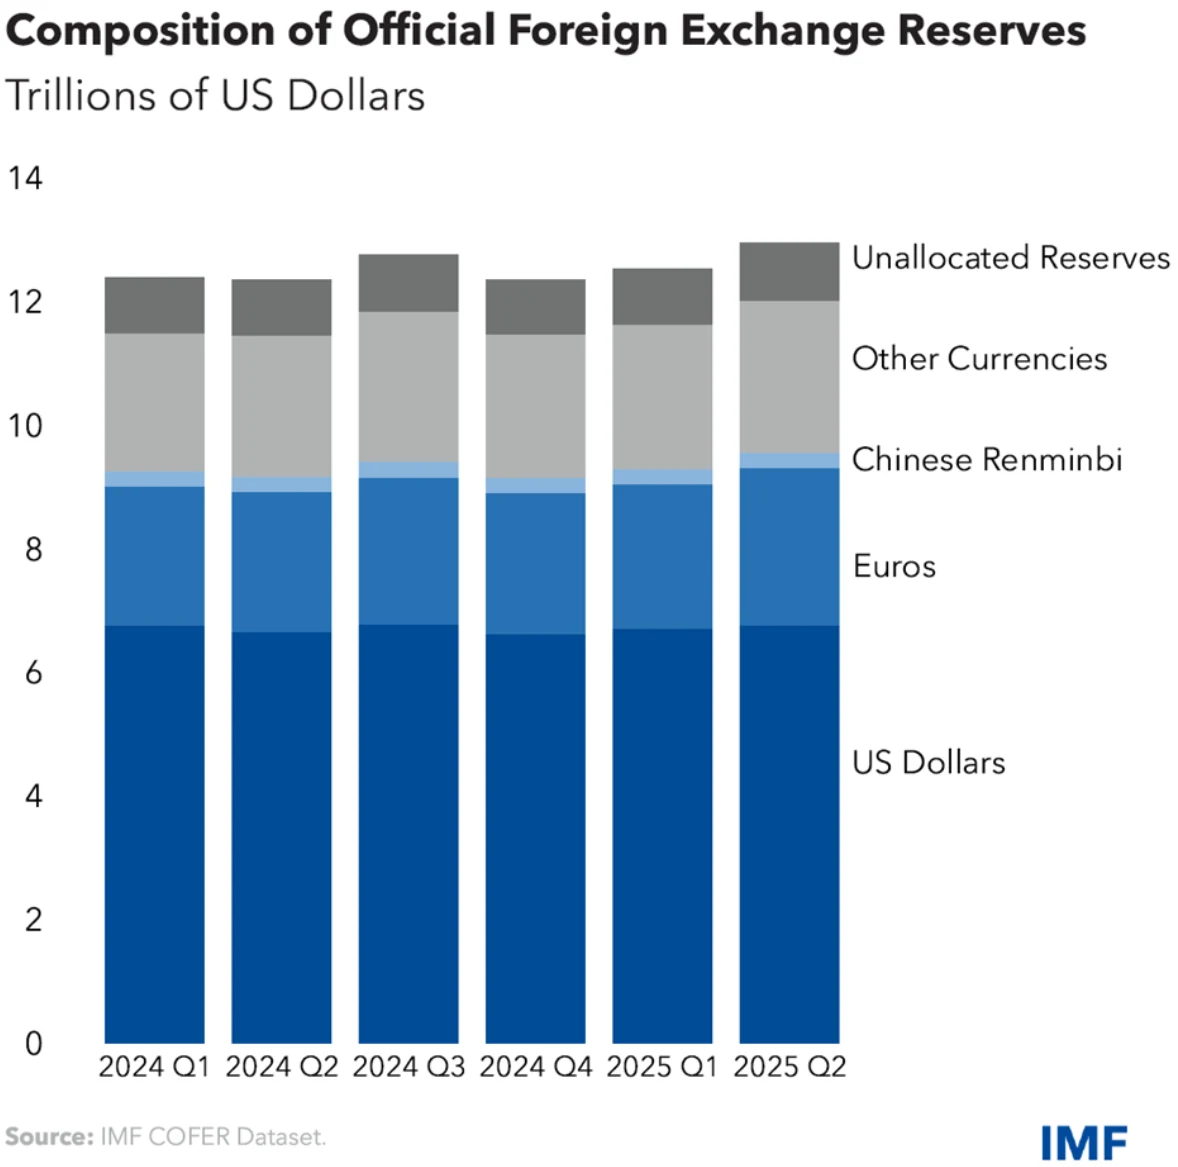
Source: IMF
Gold has emerged as a major alternative reserve asset. From 2020 through H1 2025, global central banks cumulatively added over 3,800 tons of gold, increasing its share of global reserve assets from 6.41% to 11.2%—the highest level since the collapse of the Bretton Woods system in 1971. China, India, and Brazil were the largest buyers: the People’s Bank of China added 85 tons in H1 2025, bringing total reserves to 2,377 tons by the end of June; India added 70 tons, bringing total reserves to 1,470 tons. This shift in allocation is primarily driven by hedging against dollar depreciation and U.S. fiscal uncertainty. The Swiss National Bank, for example, explicitly reduced its dollar holdings from 45% to 38% while increasing euro holdings from 30% to 35%, reflecting declining confidence in the dollar among central banks of advanced economies.
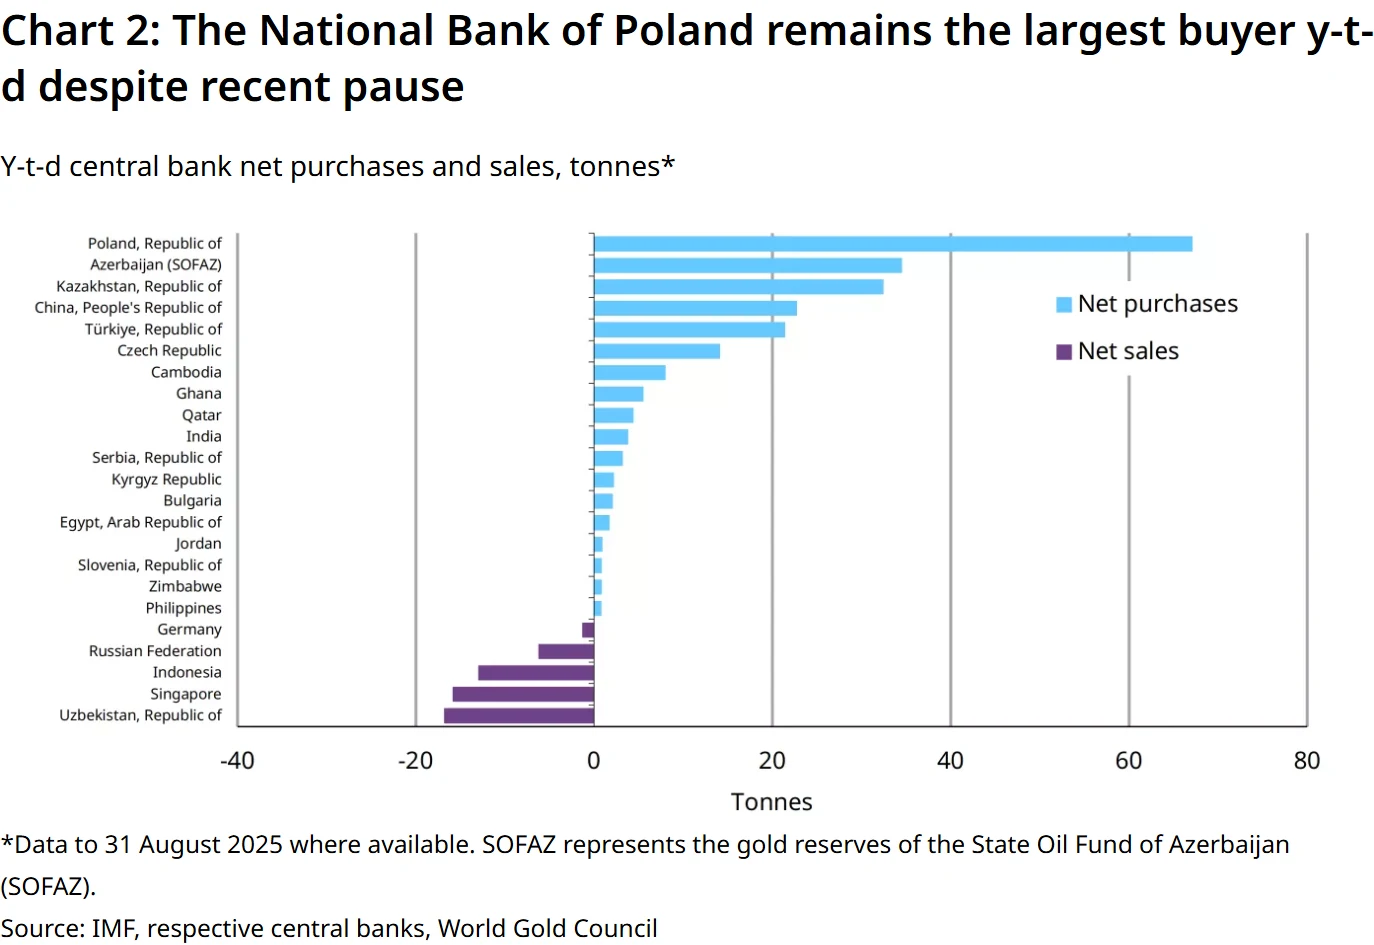
Source: World Gold Council
The expansion of non-dollar settlement systems is further diverting demand away from the dollar. At the 2025 BRICS summit in Rio de Janeiro, member countries reported that trade settled in local currencies rose from 15% in 2020 to 90%, including 100% of Brazil-China soybean trade settled in BRL-CNY. Within ASEAN, a multilateral framework set a target of over 30% regional trade settlement in local currencies by 2025. In H1 2025, intra-ASEAN trade settled in local currencies grew 45% YoY, and local currency bond issuance by Indonesia and Malaysia reached record highs.
Despite these diversification trends, the dollar’s core position remains difficult to replace in the near term. The dollar still accounts for 88% of global foreign exchange trading, 50% of global trade settlements, and 60% of international debt issuance. U.S. Treasuries maintain a significant liquidity advantage—average daily trading volume reached $1.068 trillion in February 2025, far exceeding Eurozone and Japanese government bonds. This “path dependency” suggests that dollar depreciation will be a gradual process rather than a sudden collapse. Morgan Stanley forecasts that by 2030, the dollar’s share of global reserves may decline to around 50% but will still retain its status as the primary reserve currency.
Central Bank Credibility
The Federal Reserve’s policy independence has long been a cornerstone of the U.S. dollar’s credit, but political intervention risks have risen sharply since 2025, fueling market concerns about “fiscal-dominated” monetary policy and directly undermining the dollar’s interest rate appeal and credit foundation.
Signs of political pressure have already appeared in the Fed’s policy operations in 2025. At its September FOMC meeting, the Fed cut the policy rate by 25 basis points to 4.00%-4.25%—its first rate cut of 2025 and a continuation of the December 2024 easing.
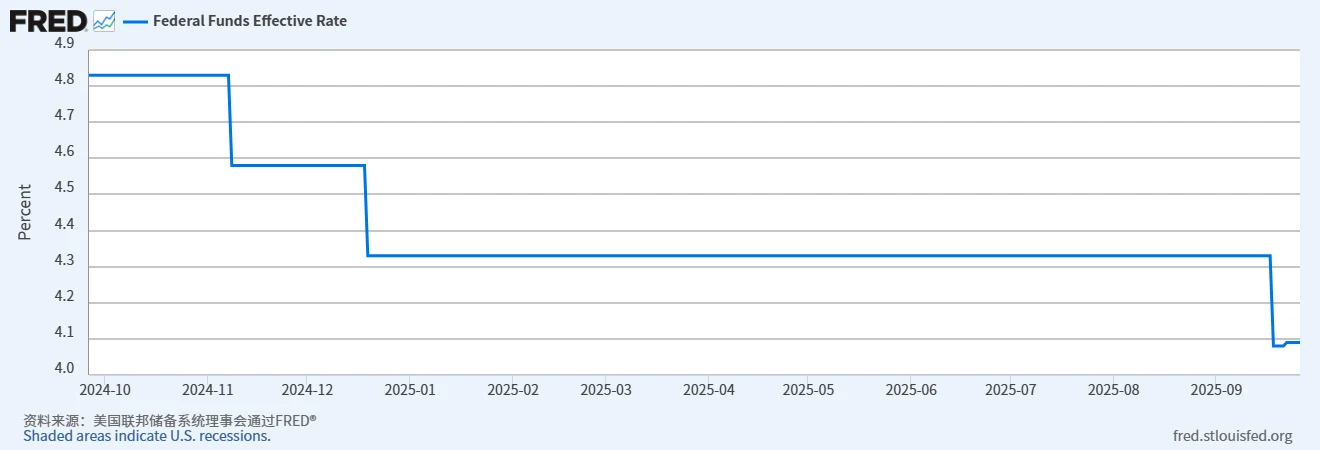
Source: FRED
Although the meeting statement attributed the cut to “rising downside risks to employment,” the market widely viewed political pressure as a key driver. The Trump administration had previously publicly called for a “50-basis-point one-off cut,” while newly appointed Fed Governor Stephen Milan (Trump nominee) cast the sole dissenting vote in favor of a 50-basis-point cut. Chair Powell indicated that broader support for a larger cut did not materialize. This combination of internal dissent and political influence has raised widespread doubts about the Fed’s “resistance to interference.”
More strikingly, direct executive pressure on central bank officials broke historical precedent. On August 25, 2025, the Trump administration announced via social media the immediate dismissal of Fed Governor Lisa Cook, citing “alleged mortgage fraud”—the first time in the Fed’s 111-year history that a president has removed a sitting governor.
Although Trump invoked the Federal Reserve Act provision allowing removal “for cause,” legal experts largely questioned its legitimacy. Historically, the clause applied only to dereliction of duty or serious misconduct, not policy disagreements or unproven allegations. Following the announcement, the dollar index fell 0.3% to around 98, ending its prior gains and reflecting market repricing due to perceived erosion of central bank independence.
The misalignment between monetary and fiscal policy has further heightened credit risk. The 2025 Fed easing cycle coincided with expansive fiscal policy—$1.8 trillion in new deficit spending in FY2025—creating a “policy conflict.” Markets have grown concerned about potential inflationary rebounds: by September 2025, the U.S. 5-year inflation swap rate rose to 2.6%, up 30 basis points from June. While still within a reasonable range, the increase signals rising expectations. Goldman Sachs noted that this combination of “fiscal expansion + monetary easing” bears resemblance to the 1970s stagflation period, which could have long-term negative implications for the dollar’s credit.
Despite Chair Powell’s repeated assurances of “firmly maintaining independence” and the Fed’s legal authority over staffing and policy decisions, the effects of political interference are already evident. The September Fed dot plot showed that among 19 officials, 9 expected a cumulative 75-basis-point cut in 2025, 1 favored a 150-basis-point cut, and the median expectation pointed to a further 50-basis-point reduction by year-end.
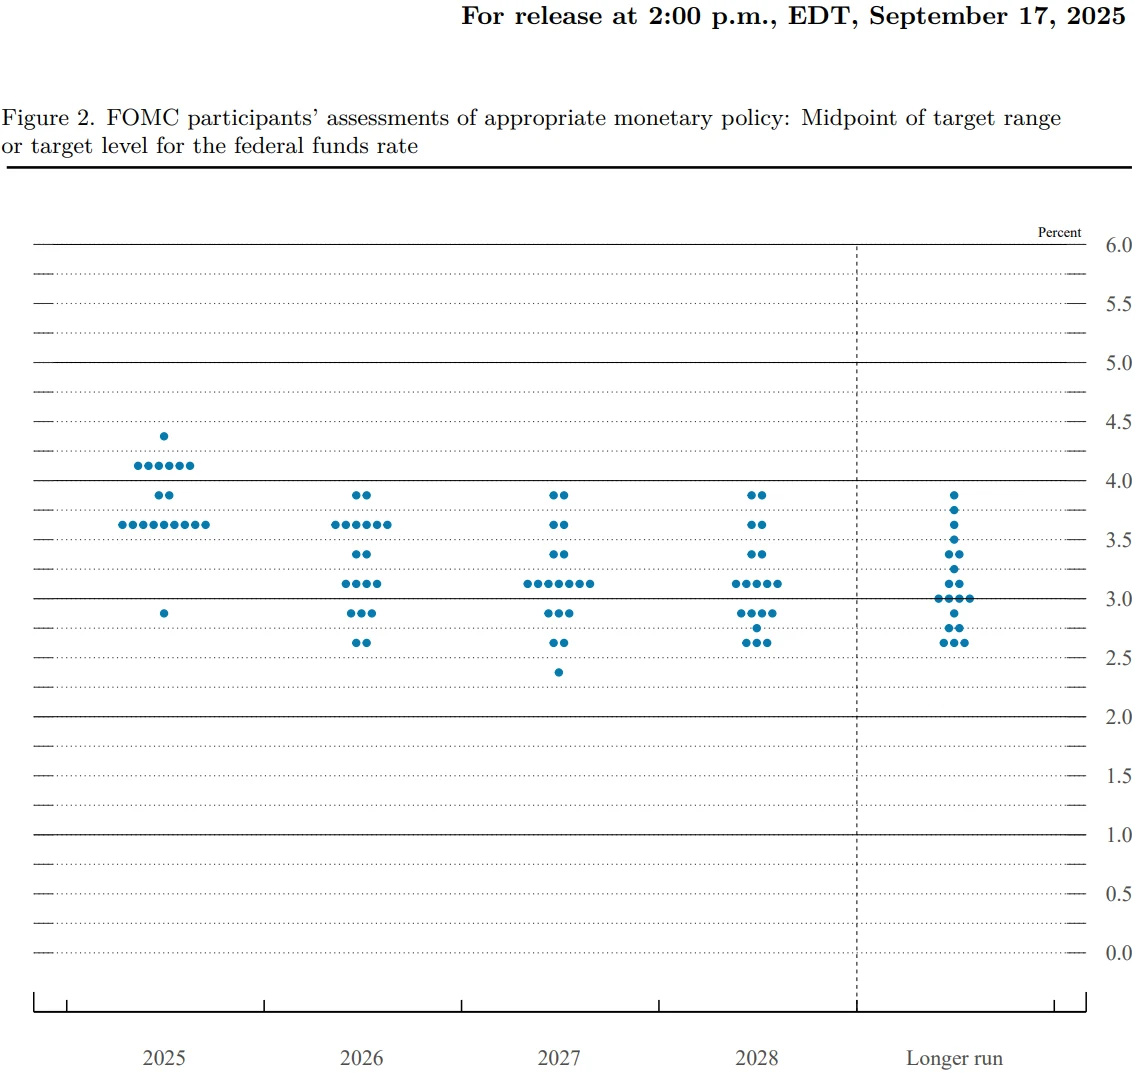
Source: Federal Reserve
Meanwhile, interest rate futures indicate that investors expect the total easing by year-end to broadly align with official projections, but concerns over an accelerated pace of easing under political pressure are growing, gradually undermining the dollar’s interest rate advantage.
Geopolitical Risk
Geopolitical factors have evolved from a “secondary variable” to a “primary driver” of the U.S. dollar’s trajectory. The use of tariffs as a policy tool, ongoing U.S.-China strategic competition, and spillover effects from localized conflicts are now impacting the dollar through trade channels and confidence channels.
The repeated imposition and escalation of tariffs have exerted direct downward pressure on the dollar. Since 2025, the U.S. has imposed a 40% ad valorem tariff on Brazilian exports, a 15% tariff on European auto parts, and introduced so-called “secondary tariffs”—a 15% indirect tariff on countries engaged in energy trade with Russia. According to data jointly released by the World Trade Organization and the IMF, the U.S. weighted average tariff rate has surged from 1.6% in 2019 to 20.1% as of July 2025, the highest level since 1933, surpassing even the tariff levels of the Great Depression.
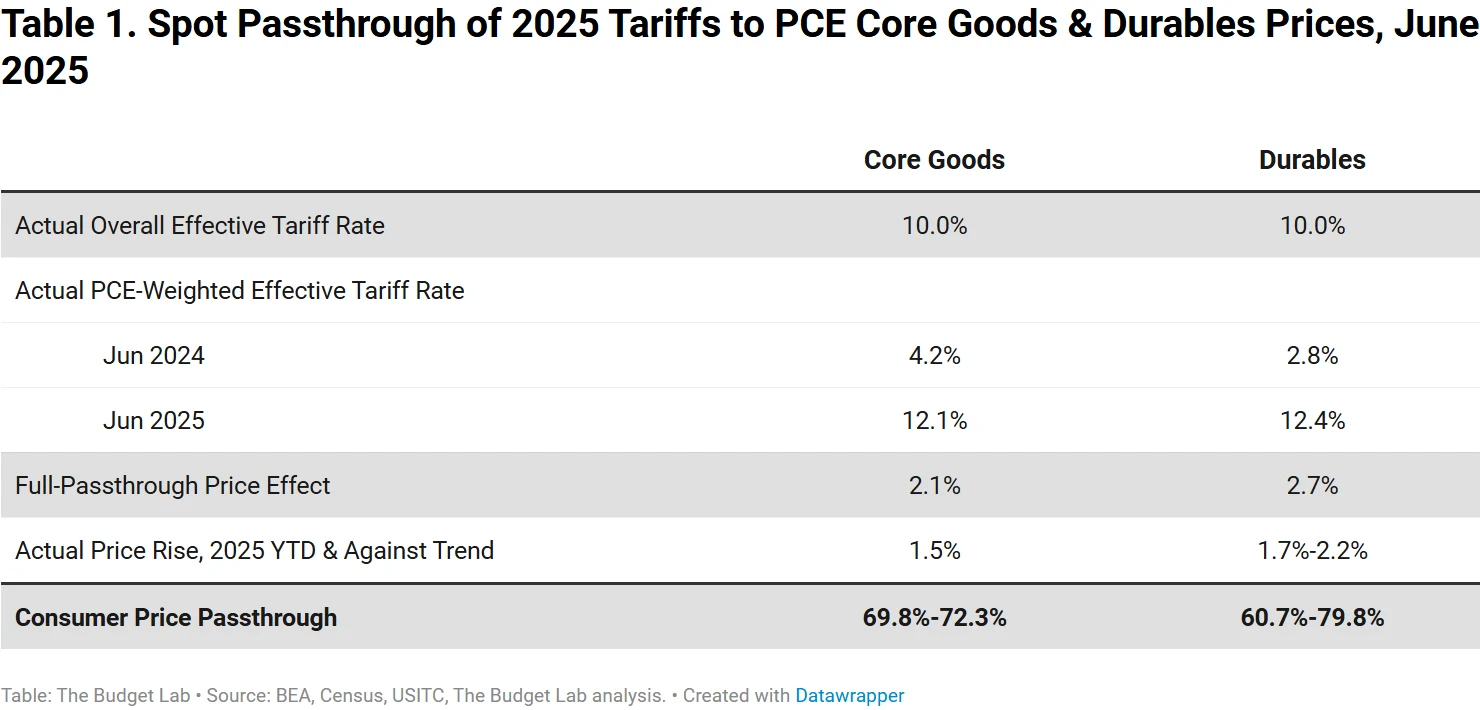
Source: The Budget Lab at Yale
This “tariff weaponization” has fueled domestic inflation. The Yale Budget Lab estimates that tariffs raised overall prices by approximately 1.7% in the short term, reducing per capita real income by around $2,300 annually, while triggering retaliatory measures from trade partners. In the first half of 2025, U.S. exports declined 2.1% year-over-year, further widening the current account deficit.
Deepening U.S.-China strategic competition has heightened uncertainty for the dollar. In 2025, technological competition in semiconductors, renewable energy, and other sectors intensified. The U.S. expanded restrictions on chip exports to China, while China implemented export controls on critical resources such as rare earths and EV batteries. This “decoupling” trend is reshaping global supply chains, increasing production costs for U.S. firms, and coinciding with a steady decline in Chinese holdings of U.S. Treasuries—from $1.2 trillion in 2020 to $730.7 billion in July 2025, a 39% drop, marking the lowest level since December 2008 and relegating China to the third-largest U.S. debt holder. This directly weakens demand support for U.S. debt.
Spillover effects from localized conflicts are also altering the dollar’s safe-haven status. The Ukraine conflict continues, with U.S. aid totaling over $75 billion, or 0.25% of GDP. Meanwhile, shifts in energy trade have quietly eroded dollar demand: in the first half of 2025, EU LNG imports rose 25% year-over-year, with only 14% sourced from Russia and 55% from the U.S. While Europe’s reliance on U.S. gas increased, this did not translate into a proportional rise in dollar-denominated settlements.
Attention should also be paid to rising tensions in the Middle East. In Q3 2025, risks to oil shipments through the Strait of Hormuz increased. Direct U.S. involvement could further raise defense spending, exacerbate fiscal pressure, and trigger investor concerns over the “safety of dollar assets.” In April 2025, during a decline in the S&P 500, the dollar index fell in tandem, breaking the traditional “equities down, dollar up” safe-haven correlation, reflecting diminishing market confidence in the dollar’s protective role.
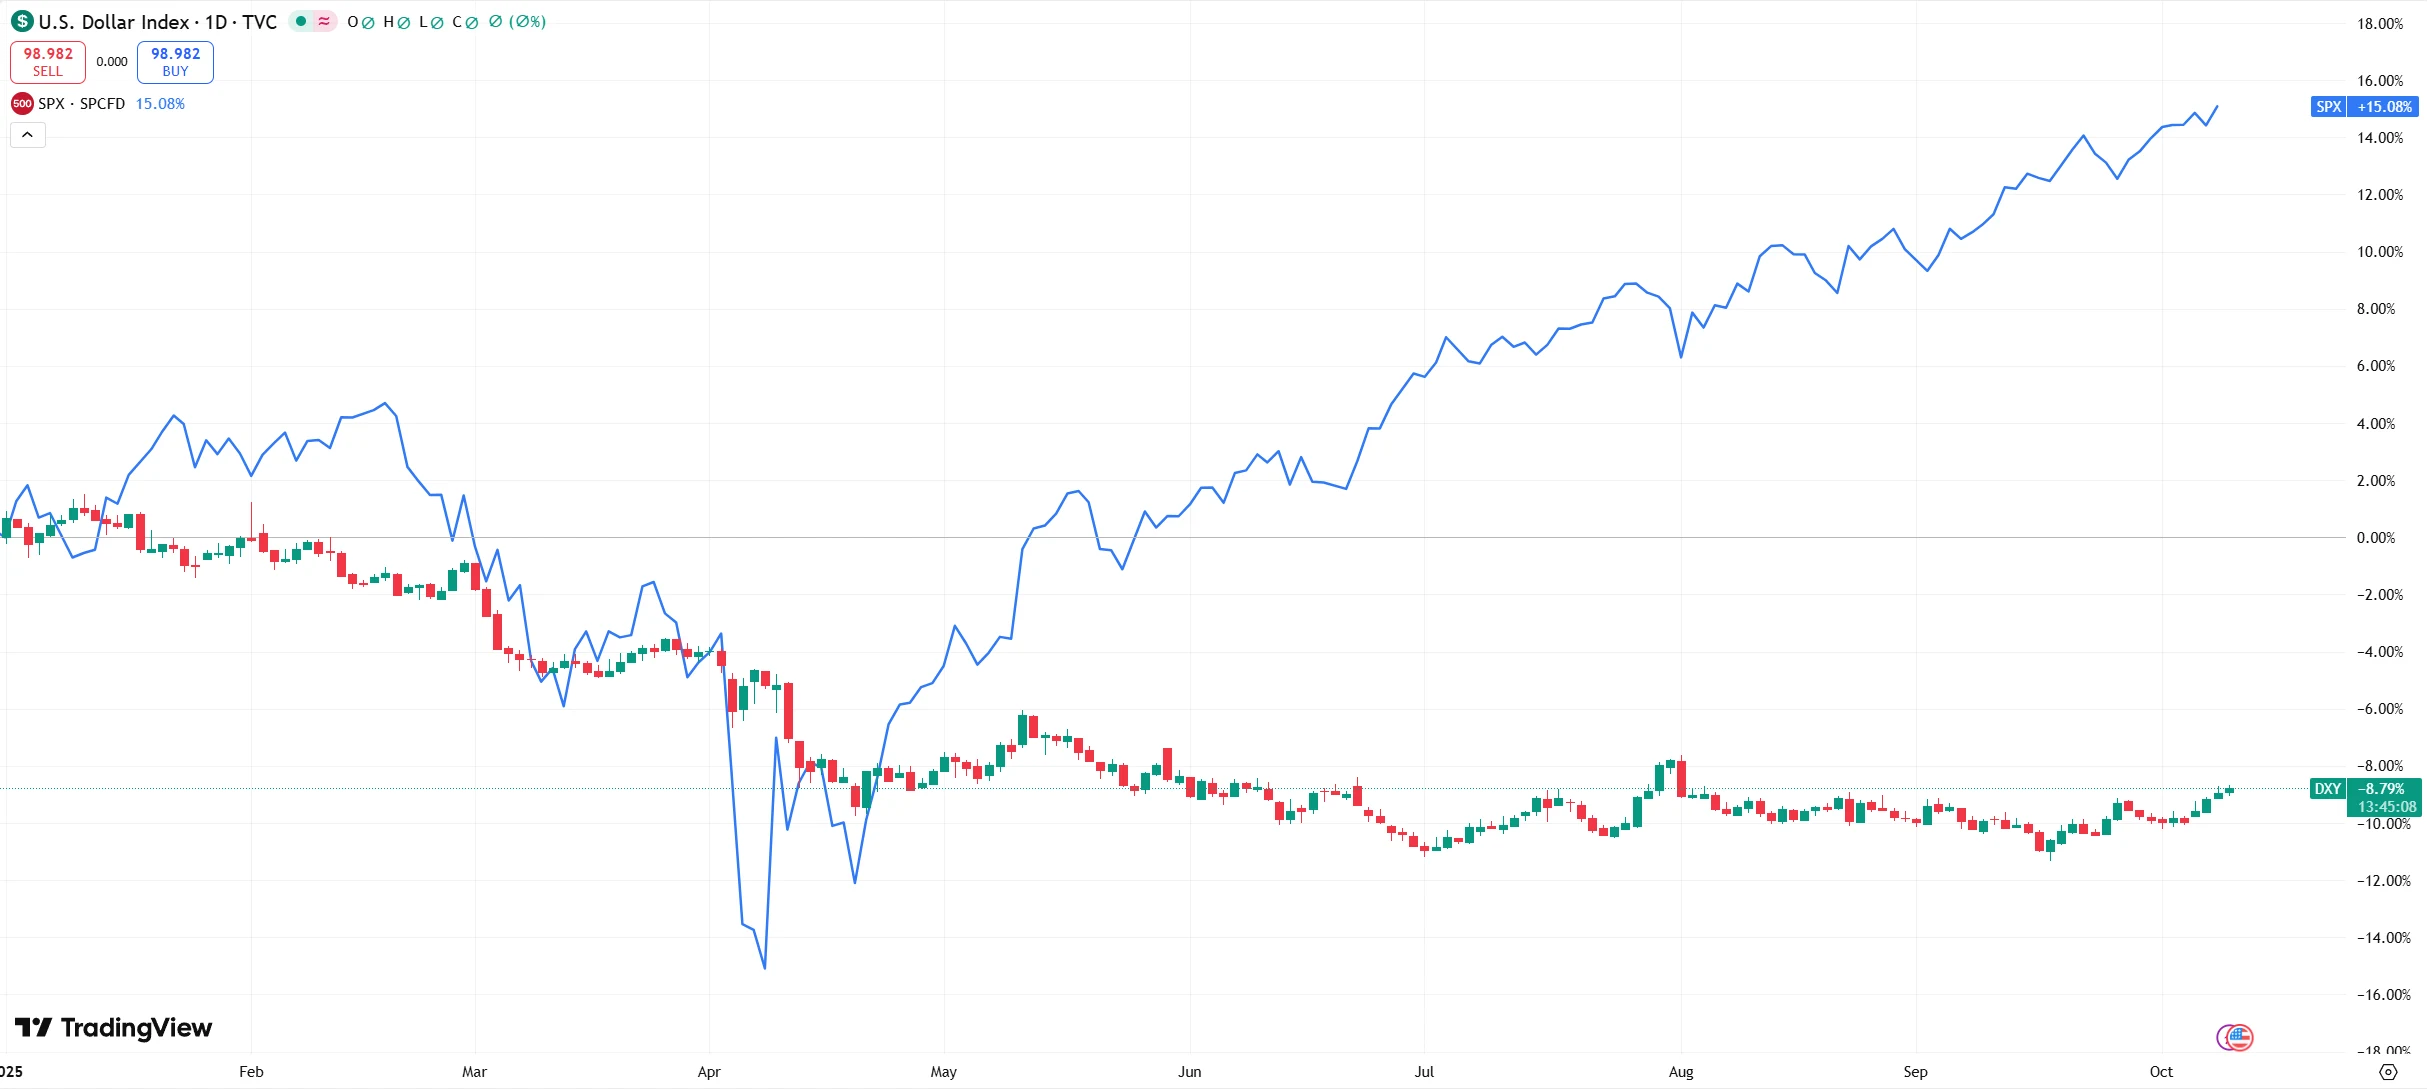
Source: TradingView
Final Thoughts
The U.S. dollar remains the cornerstone of the global financial system, underpinned by its unmatched market depth, liquidity, and broad international trust. However, its long-term structural support is gradually weakening. The combined effects of fiscal pressures, external dependencies, geopolitical tensions, and political interference suggest a gradual depreciation trend for the dollar over the coming years.
From a temporal perspective, the dollar is expected to face sustained downward pressure over the next 3–5 years. This does not imply an abrupt loss of its status as the global reserve currency. Rather, the process may coincide with a slow restructuring of the international monetary system—shifting from “dollar dominance” toward a “multi-currency coexistence” framework—without a single currency fully supplanting the dollar.
In this context, investors may need to reassess the dollar’s relative appeal within international portfolios. Hedging dollar exposures and implementing currency-hedged foreign investments are likely to play an increasingly important role in future asset allocation strategies.
Disclaimer: The content of this article does not constitute a recommendation or investment advice for any financial products.

Email Subscription
Subscribe to our email service to receive the latest updates
