Fed Kicks Off Rate Cuts, But Mortgage Rates May Not Follow
![]() FoolBull
FoolBull
03:47 September 29, 2025 EDT
Key Points:
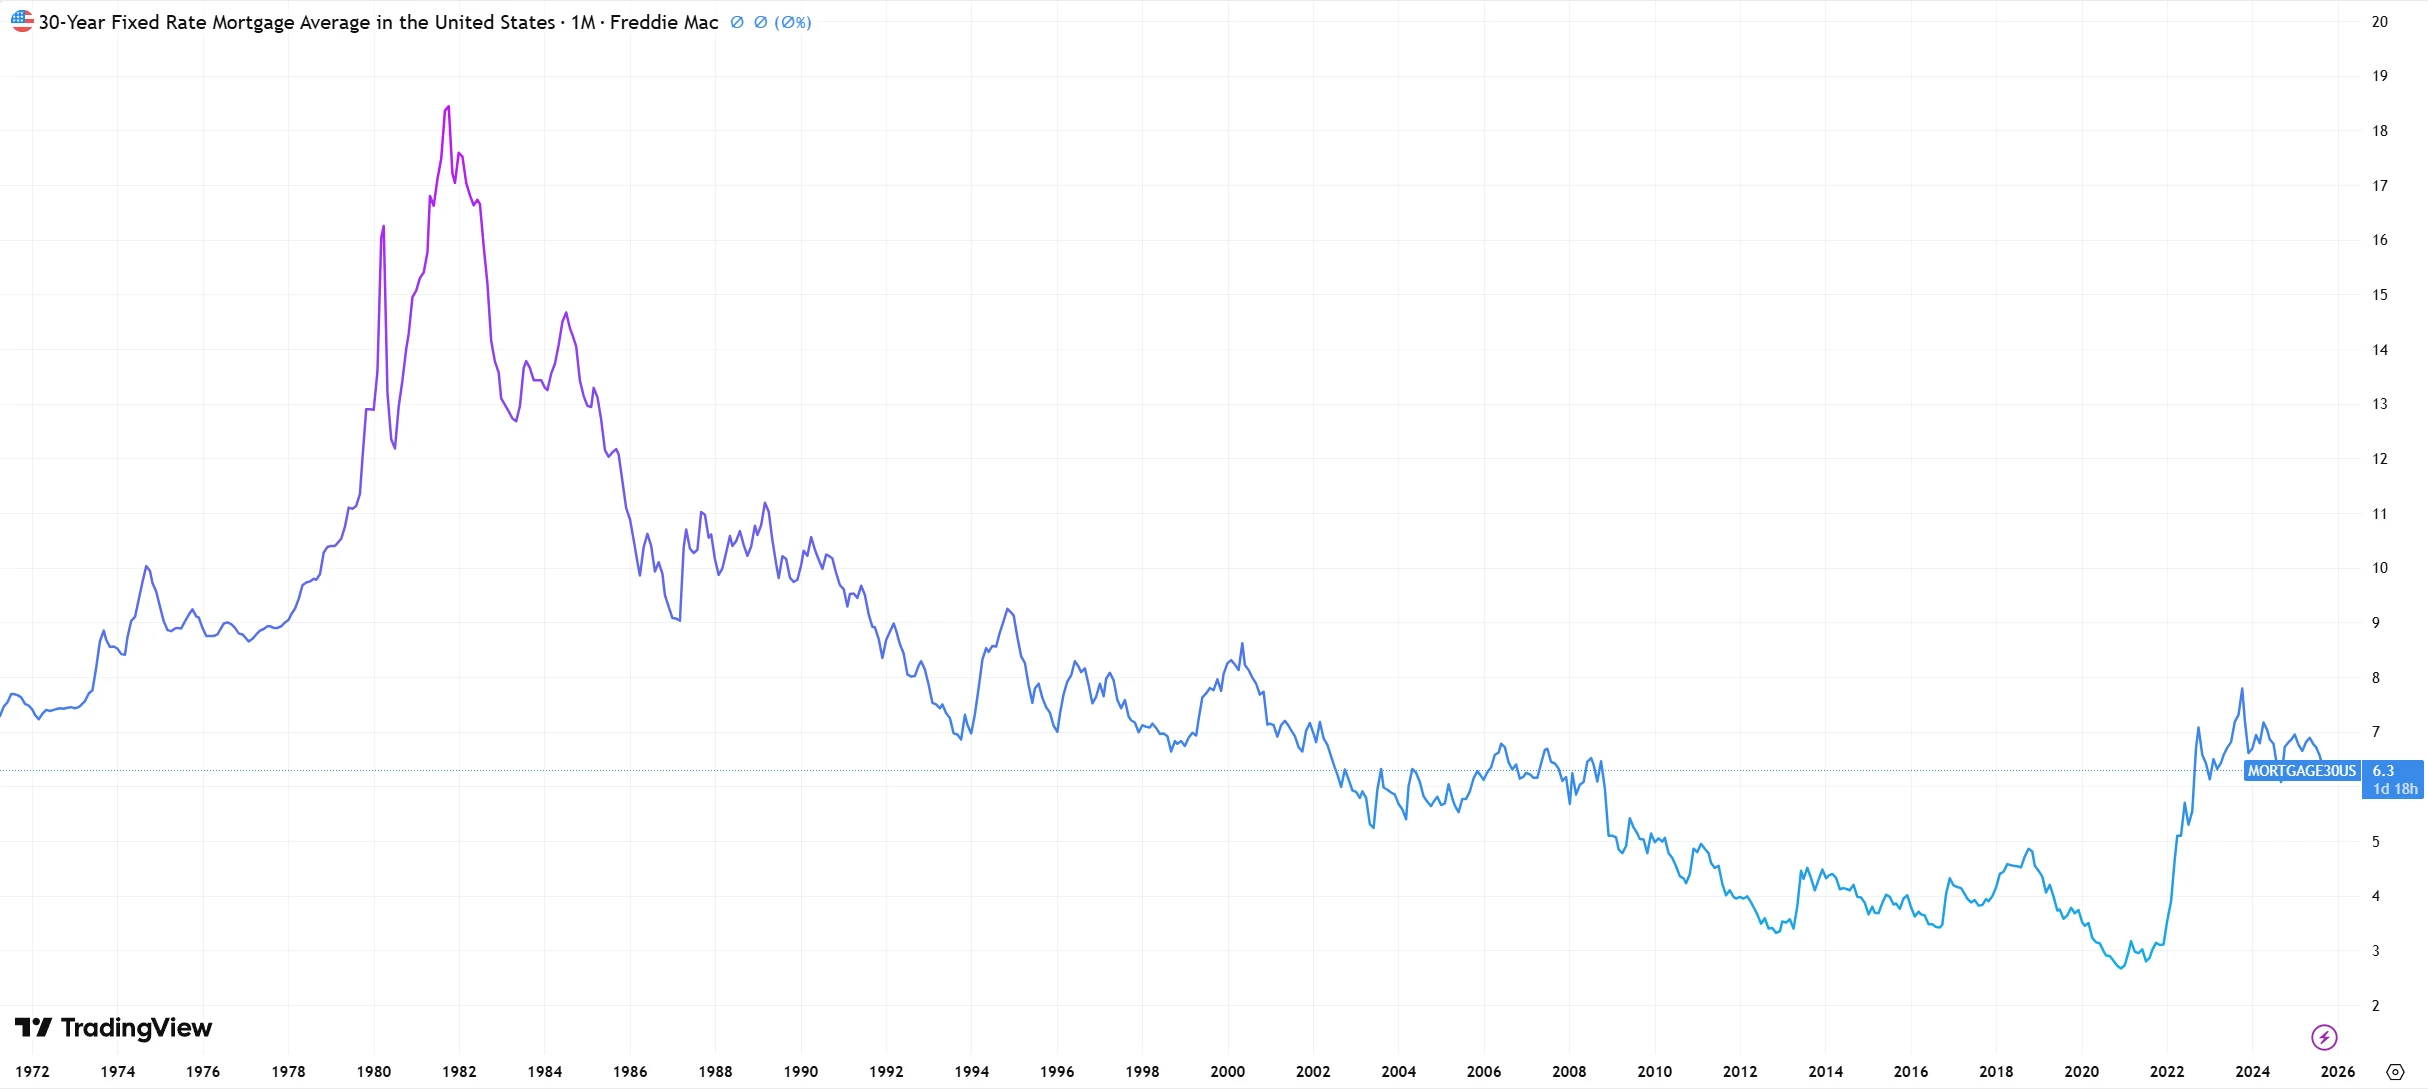
In September 2024, the Federal Reserve initiated a new rate-cut cycle, lowering the policy rate by 50 basis points in its first move. Market consensus anticipated a corresponding decline in housing finance costs, yet the actual trajectory deviated from expectations.
Interest rate policy remains a key tool for the Fed to manage the economy, but its transmission to the mortgage market is neither uniform nor instantaneous. Rate dynamics vary across different economic and policy contexts.
In the current cycle, a combination of growth resilience, sticky inflation, fiscal expansion, and QT policies has rendered long-term yields largely “immune” to rate cuts. Should inflation persist above the 2% target and unemployment remain stable, mortgage rates are likely to stay above the 6% range.
In September 2024, the Federal Reserve launched a new rate-cut cycle, reducing the policy rate by 50 basis points. Market participants widely expected housing finance costs to fall accordingly. However, the actual outcome contradicted conventional expectations: the 30-year fixed mortgage rate rose from 6.09% at the time to 6.84% by November 2024, an increase of 75 basis points. Despite subsequent rate cuts—25 basis points in November and December 2024, and another 25 basis points in September 2025, totaling 125 basis points—the mortgage rate only fell to around 6.35%, remaining above prior market expectations.
Source: TradingView
Instances of such divergence between policy rates and borrowing costs have occurred multiple times historically. Since 1970, the 10-year U.S. Treasury yield has risen in the months following Fed rate cuts roughly 51% of the time, implying that mortgage rates moved higher nearly half of the time.
This divergence fundamentally reflects the complexity of the transmission mechanism from short-term monetary policy to long-term market rates. The Federal Reserve can directly control short-term rates such as the federal funds rate, but fixed-rate mortgage products—which dominate the housing finance market—are primarily anchored to the 10-year U.S. Treasury yield. The latter is driven by market expectations for long-term economic growth, inflation prospects, and fiscal sustainability, and does not mechanically follow changes in short-term policy rates.
Core Transmission Mechanism
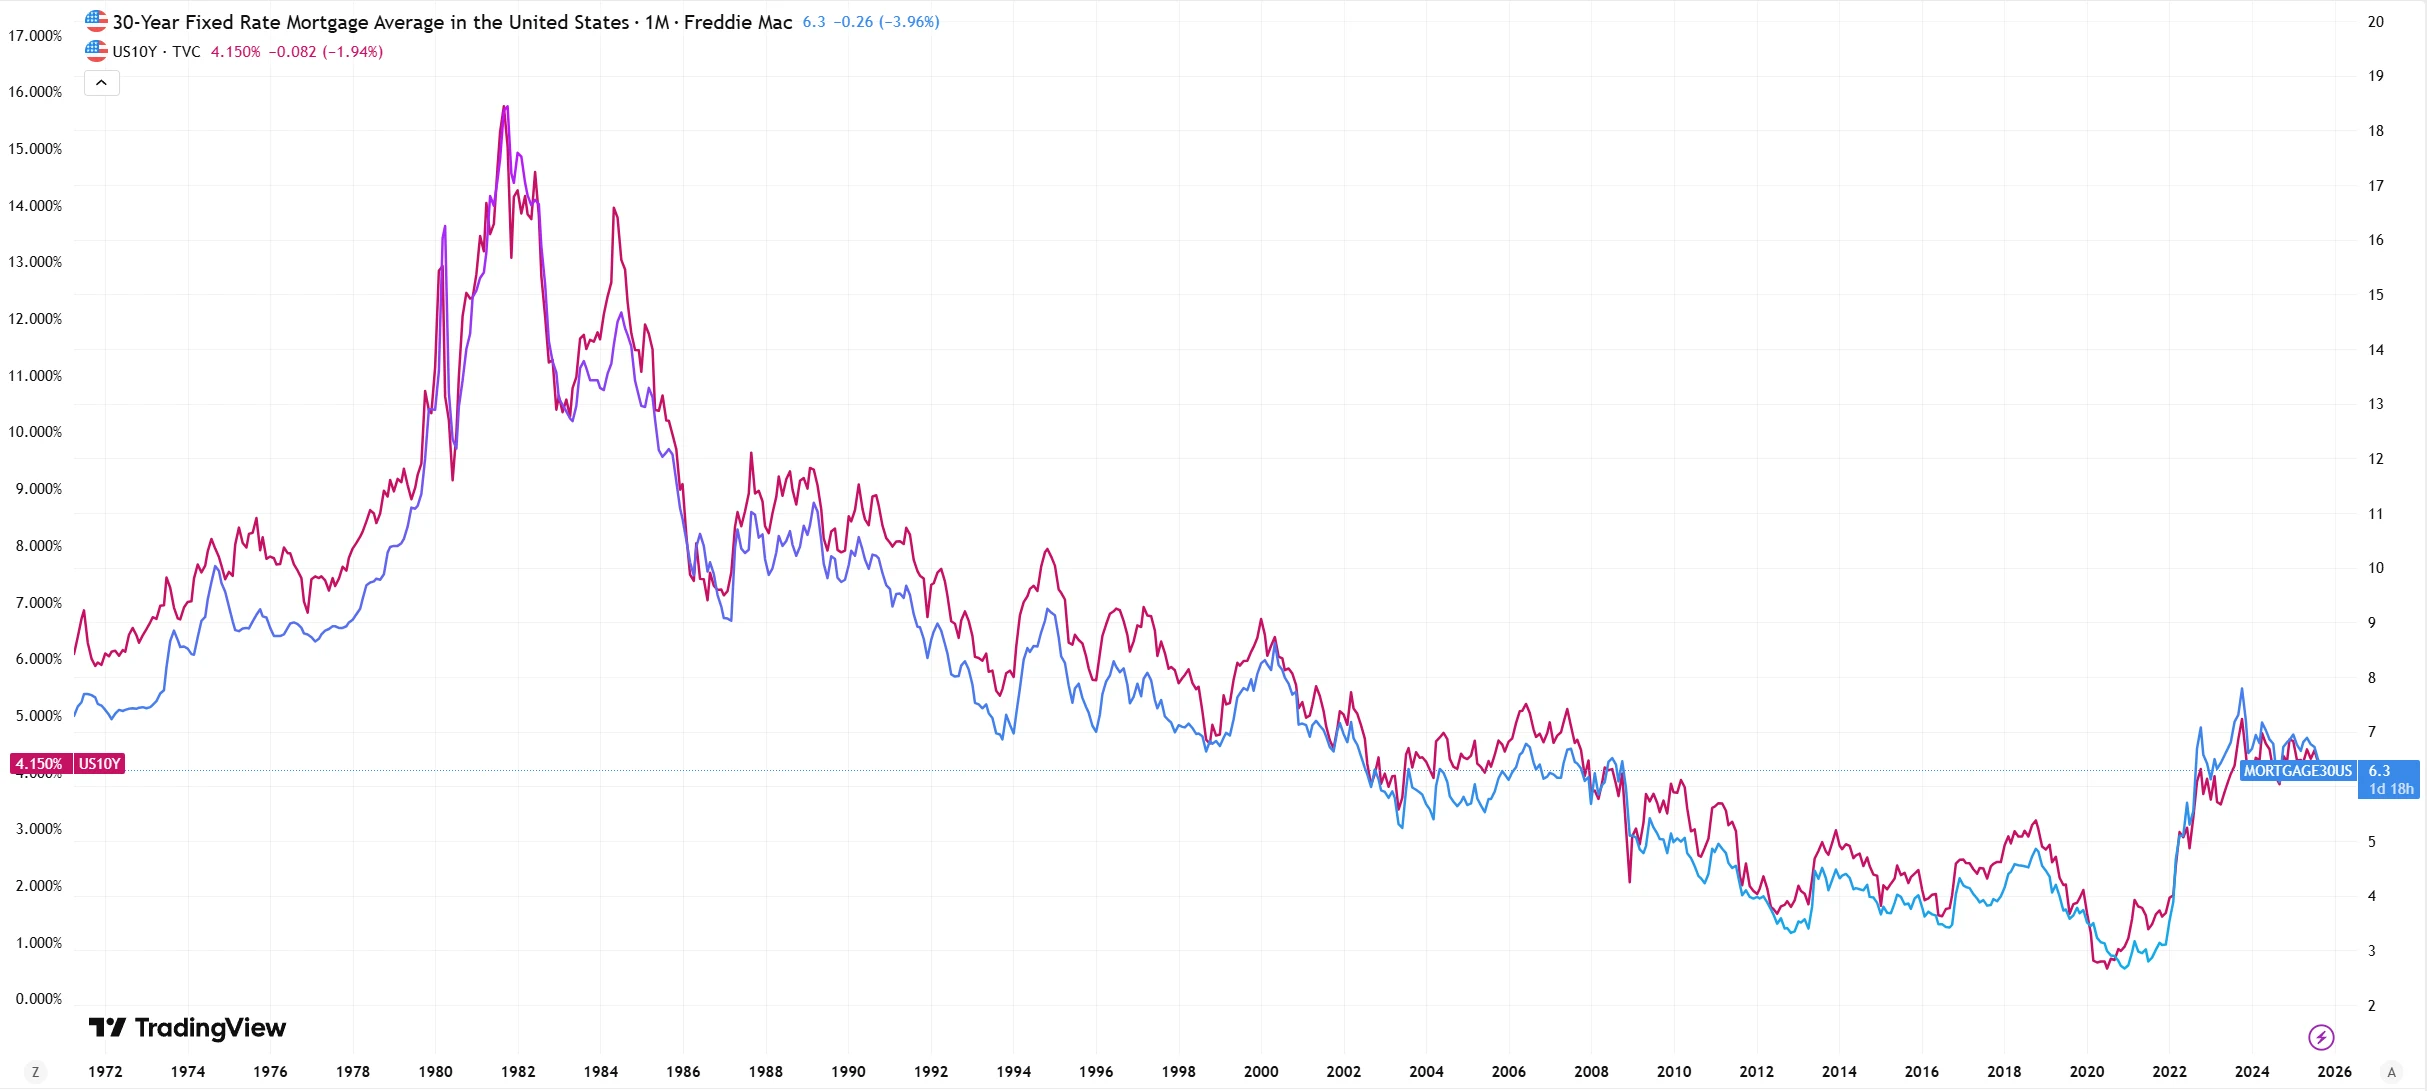
To understand this transmission discrepancy, it is essential to recognize the dominant role of the 10-year U.S. Treasury yield in mortgage rate pricing. From a quantitative perspective, the correlation between mortgage rates and the 10-year Treasury yield has consistently remained above 0.85, significantly higher than its correlation with the federal funds rate, which stands at 0.62.
The root of this strong correlation lies in the fact that both reflect the cost of long-term funding. The 10-year Treasury, as a risk-free asset, represents the market’s long-term baseline interest rate. Mortgage lenders then add a credit risk premium, liquidity premium, and operational costs to arrive at the final loan rate.
Under normal conditions, the 30-year fixed mortgage rate typically exceeds the 10-year Treasury yield by 1.5–2.0 percentage points. This spread remains relatively stable in tranquil market periods but can widen significantly when risk perceptions increase.
Source: TradingView
The transmission from short-term policy rates to long-term yields involves multiple layers of uncertainty. When a rate cut is interpreted as a signal of economic weakness, safe-haven flows into Treasuries can drive up prices and push yields lower, which in turn reduces mortgage rates—a pattern clearly observed during the post-2008 financial crisis easing cycle.
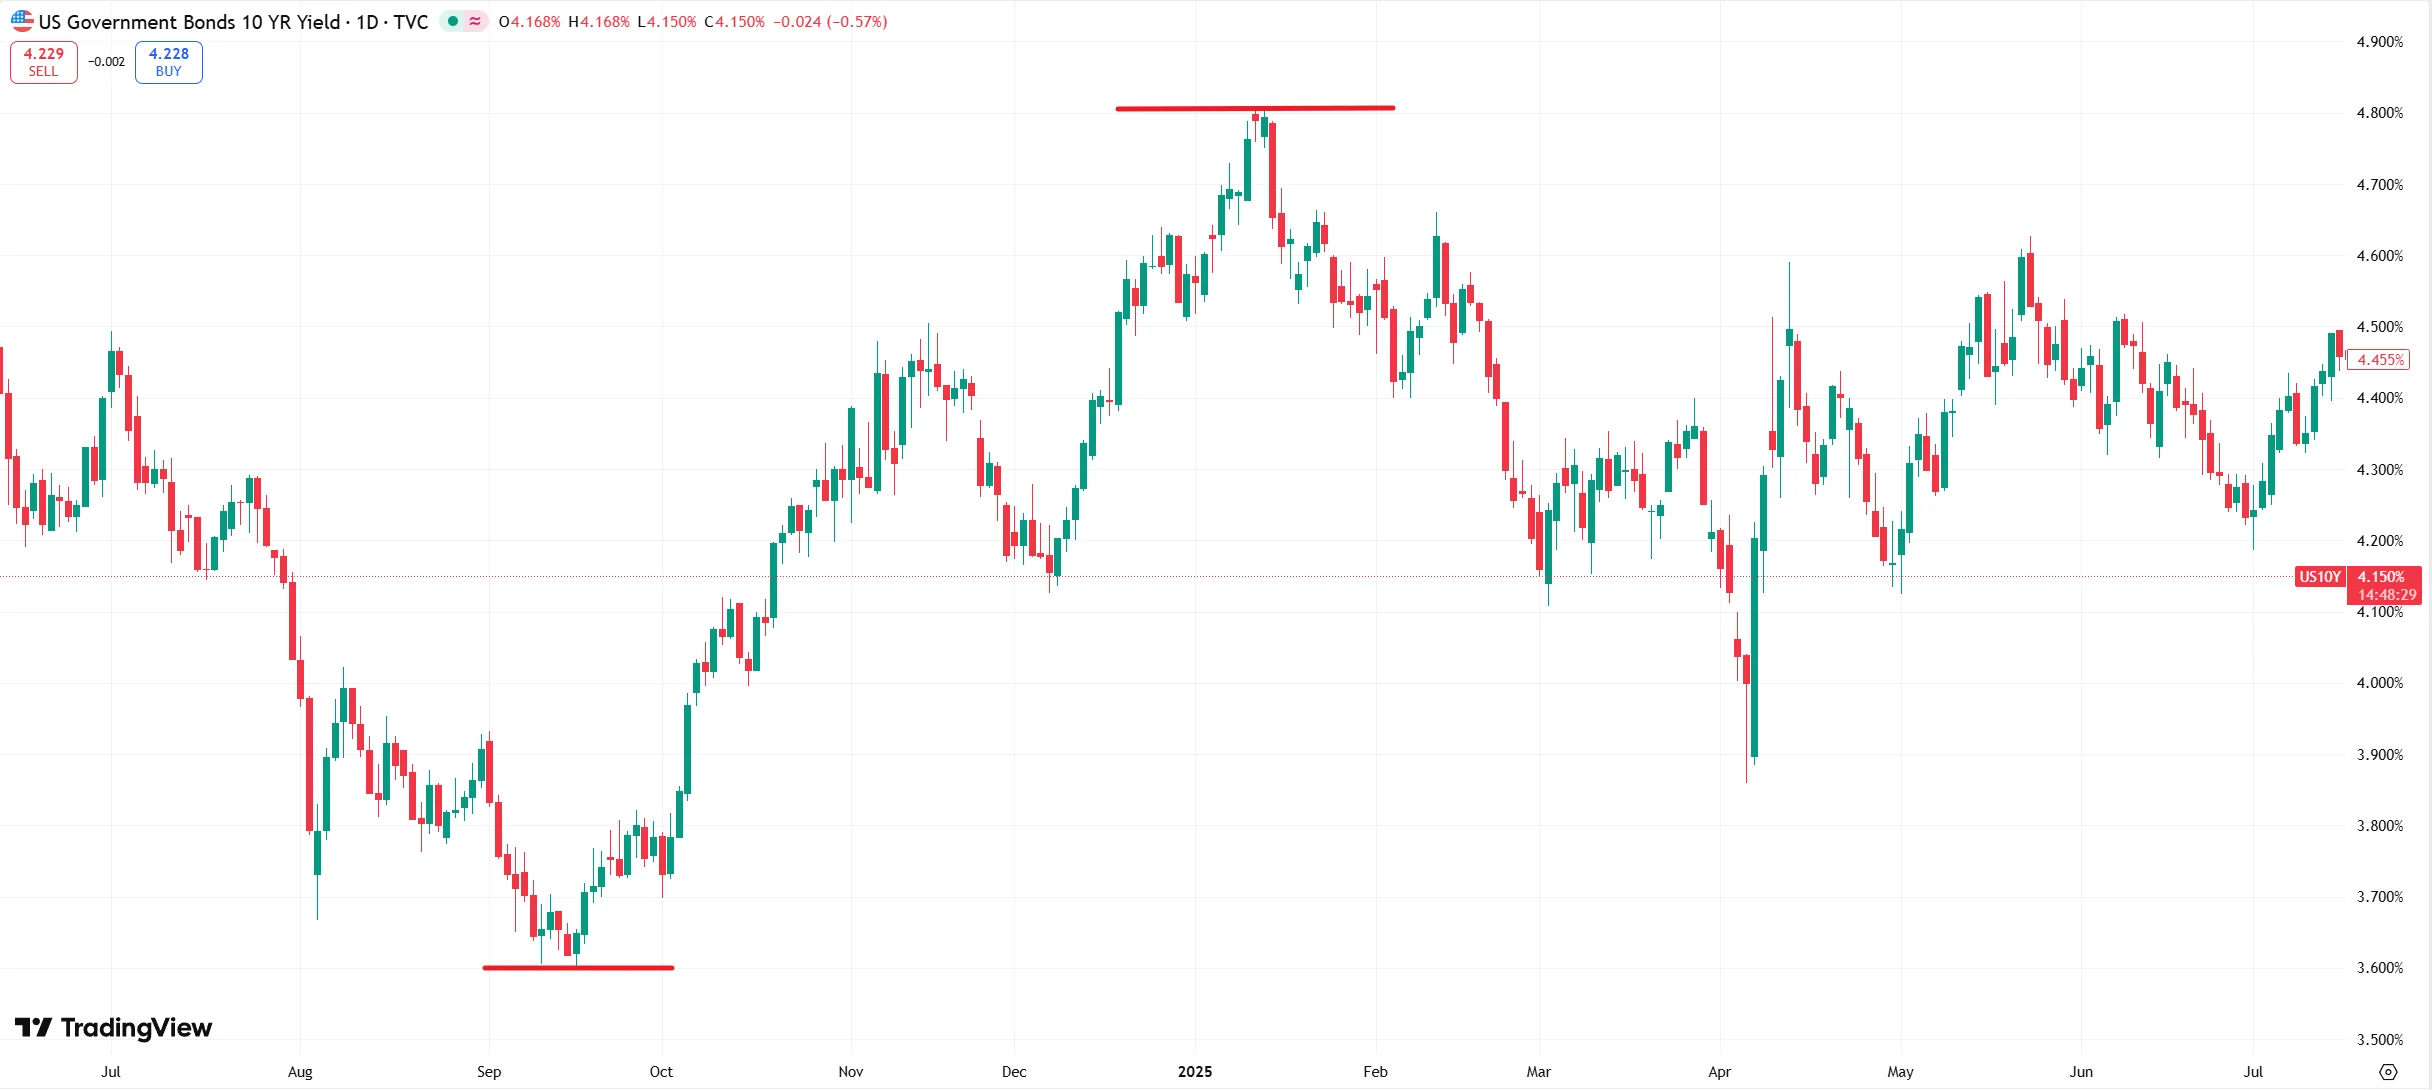
However, when rate cuts occur in a resilient economic environment, the market is more likely to view them as “preemptive easing” and may worry about potential inflationary effects. In such cases, Treasury yields may actually rise. The September 2024 rate cut illustrates this logic: the 10-year Treasury yield increased from 3.6% to 4.8% by early 2025, reflecting market concerns about inflation despite the Fed’s easing.
Source: TradingView
Historical Evidence
Monetary policy is a key tool for the Federal Reserve to manage the economy, yet its transmission to the mortgage market is neither uniform nor instantaneous. Rate movements differ across easing cycles depending on the economic context: some rate cuts are accompanied by brief declines followed by rapid rebounds, others exhibit delayed transmission amid recessionary pressures, while the current cycle has displayed behavior distinct from the past 40 years.
When the economy has not yet entered a recession, the Fed often implements preemptive rate cuts to offset external shocks or market volatility. In such cycles, mortgage rates typically follow a “short-lived decline followed by a rapid rebound” pattern.
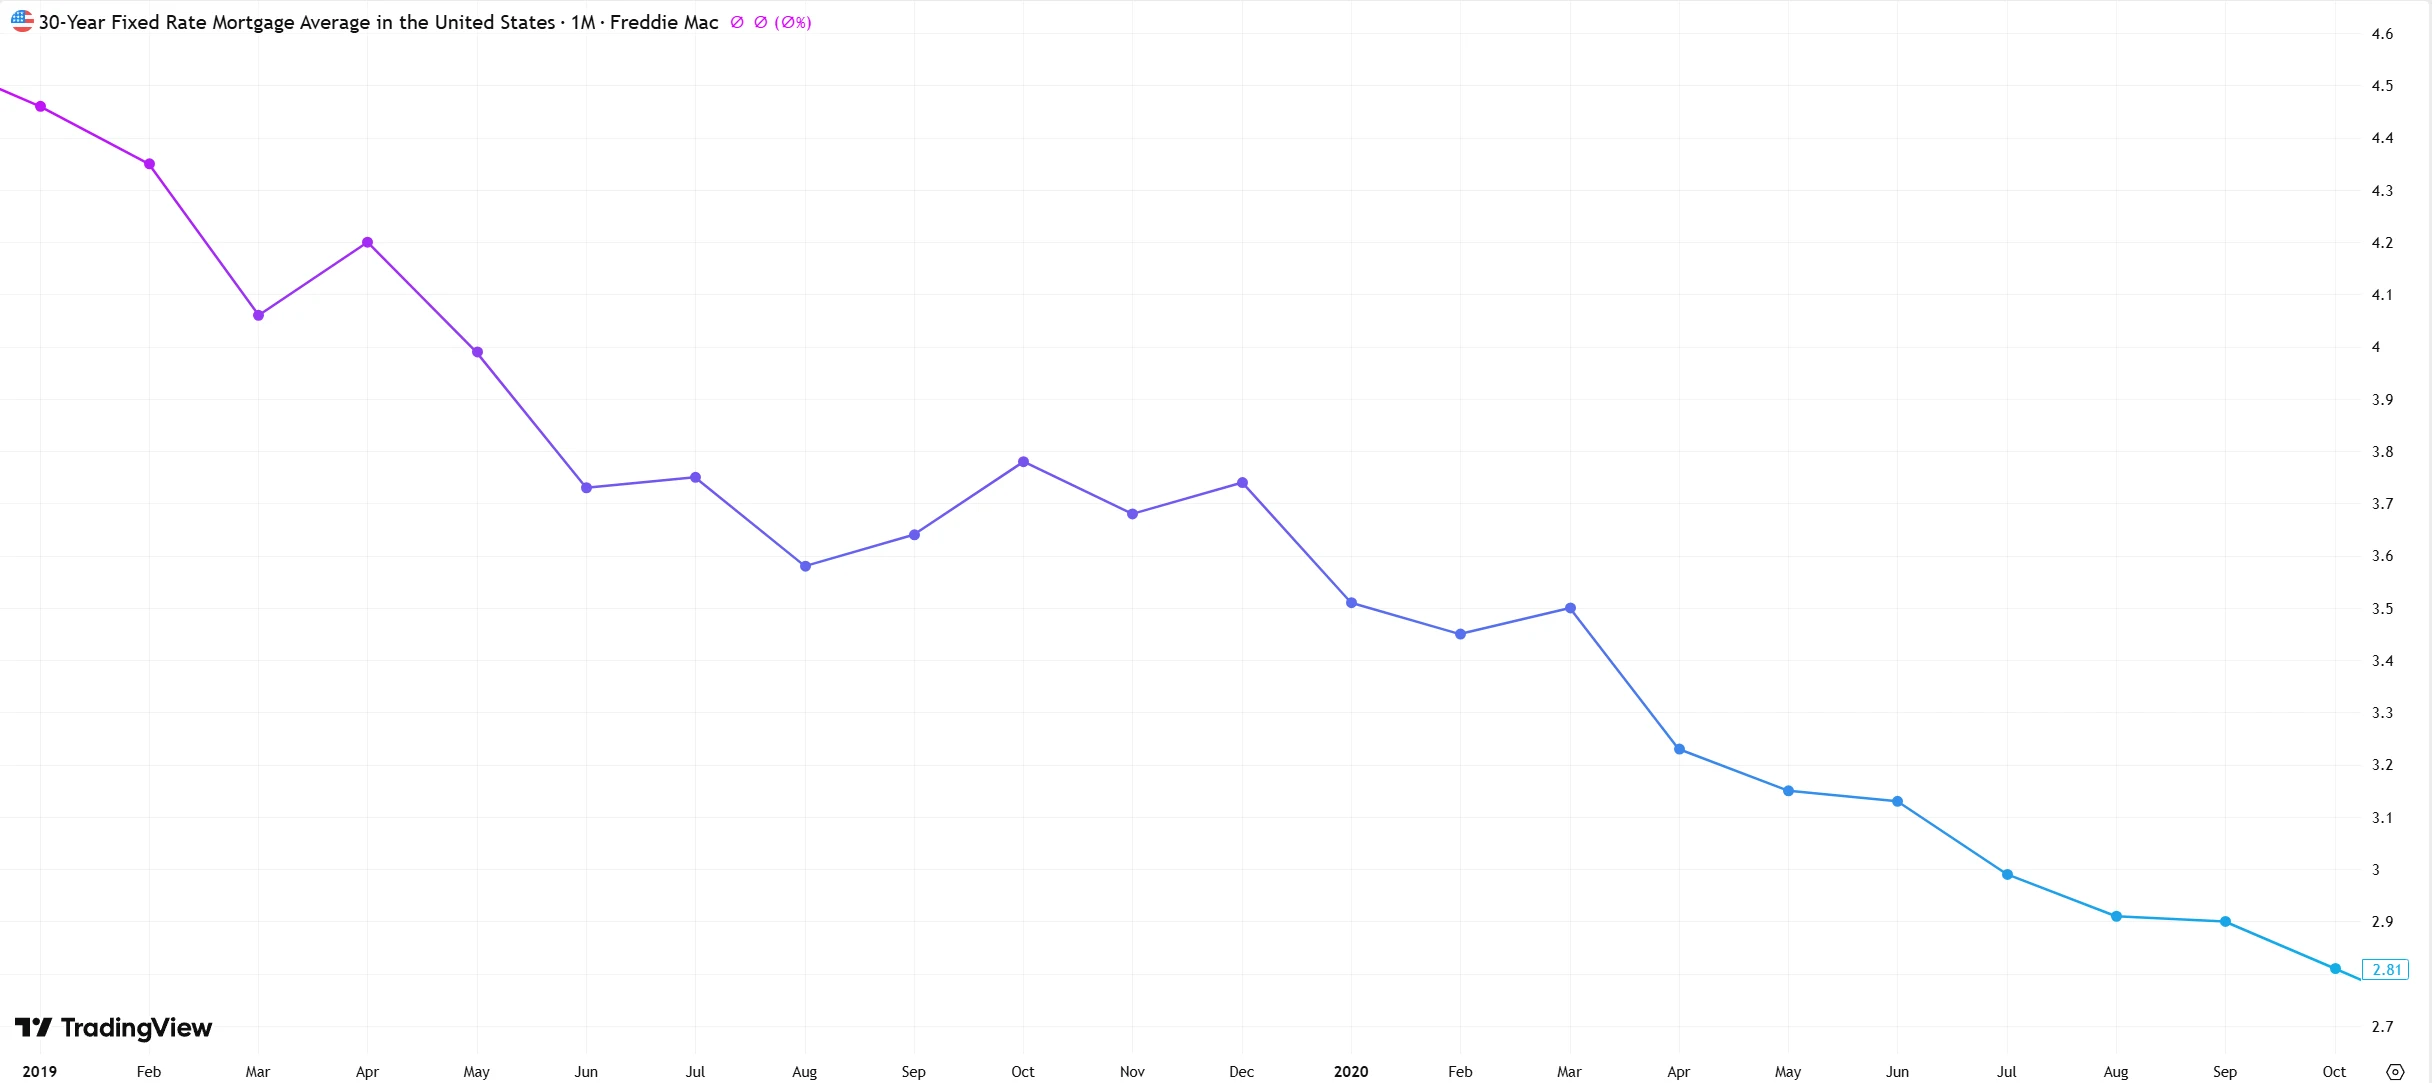
For example, in 2019, the Fed cut rates three times for a cumulative 75 basis points, pushing the 30-year mortgage rate from 3.7% to 3.5%. However, as Q3 GDP growth unexpectedly rebounded to 2.1%, market concerns about a recession eased, and rates rebounded to 3.75% by November of the same year. A similar case occurred in 1998, when the Fed cut rates three times for a total of 75 basis points, yet the 10-year Treasury yield rose 40 basis points within two months after the first cut, driving mortgage rates higher in tandem.
Source: TradingView
The common feature of such cycles is that the economic fundamentals do not deteriorate systematically; the rate cuts primarily serve as risk mitigation measures, while long-term growth and inflation expectations remain largely intact. As a result, long-term yields struggle to sustain a downward trajectory. Research from Shenwan Hongyuan Securities indicates that during preemptive easing, declines in the 10-year Treasury yield are smaller and rebounds occur sooner.
By contrast, crisis-driven rate cuts typically occur when the economy is already in recession. In these scenarios, mortgage rates eventually fall significantly, but the transmission process exhibits substantial lag.
In December 2008, the Fed reduced the federal funds rate to near zero and launched quantitative easing; however, the 30-year mortgage rate did not drop below 4.5% until October 2010—almost two years after the first rate cut.
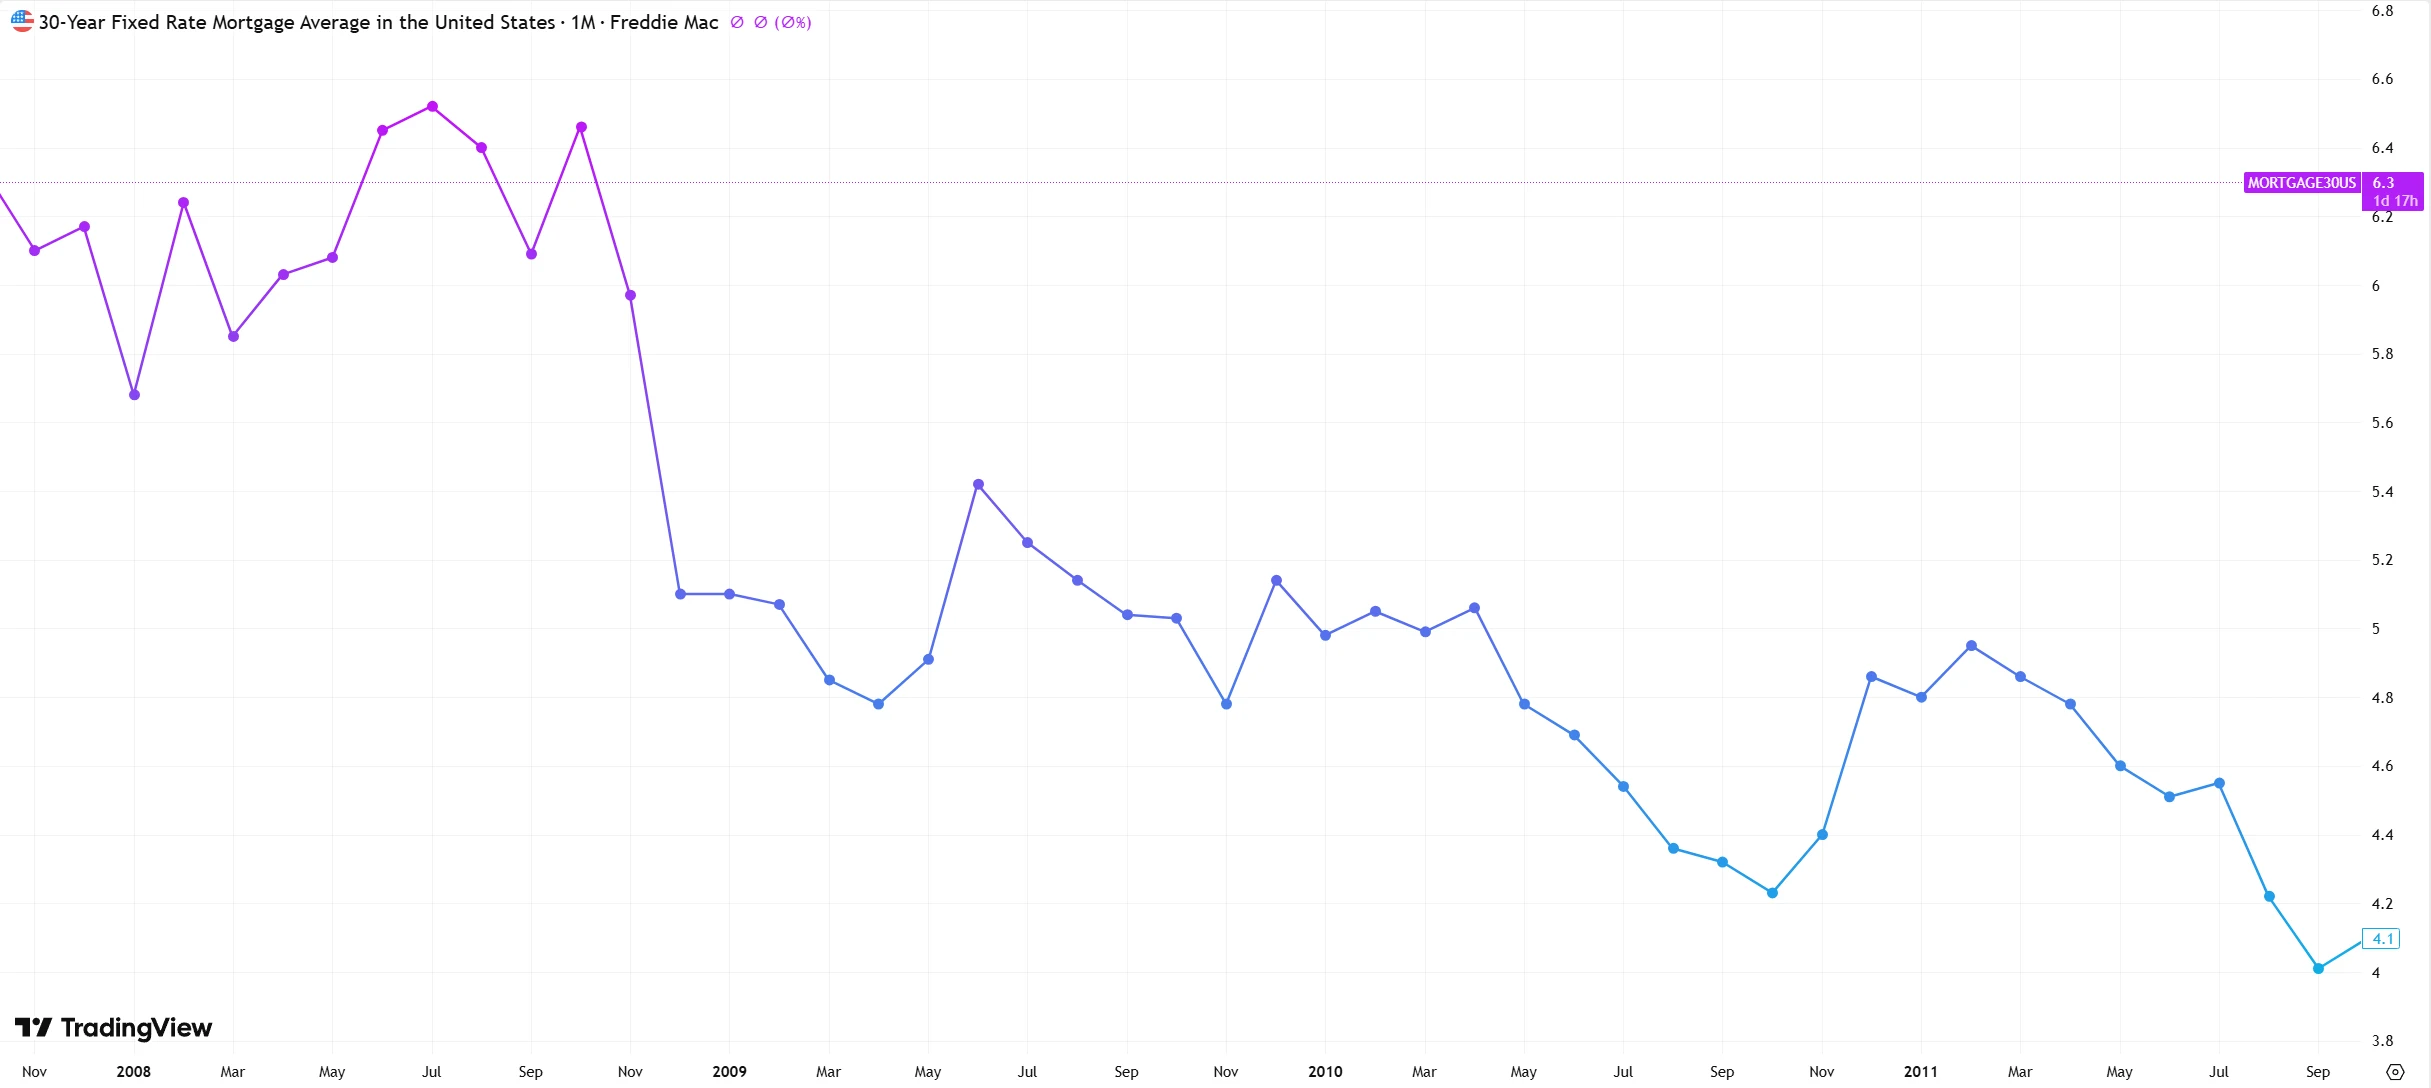
Source: TradingView
The underlying reason is that early in the policy cycle, markets grappled with inflation concerns from QE alongside uncertainty about the recovery path, keeping the 10-year Treasury yield fluctuating between 2.5% and 4.0% in 2009. It was not until mid-2011 that yields consistently fell below 2%, gradually pushing mortgage rates lower.
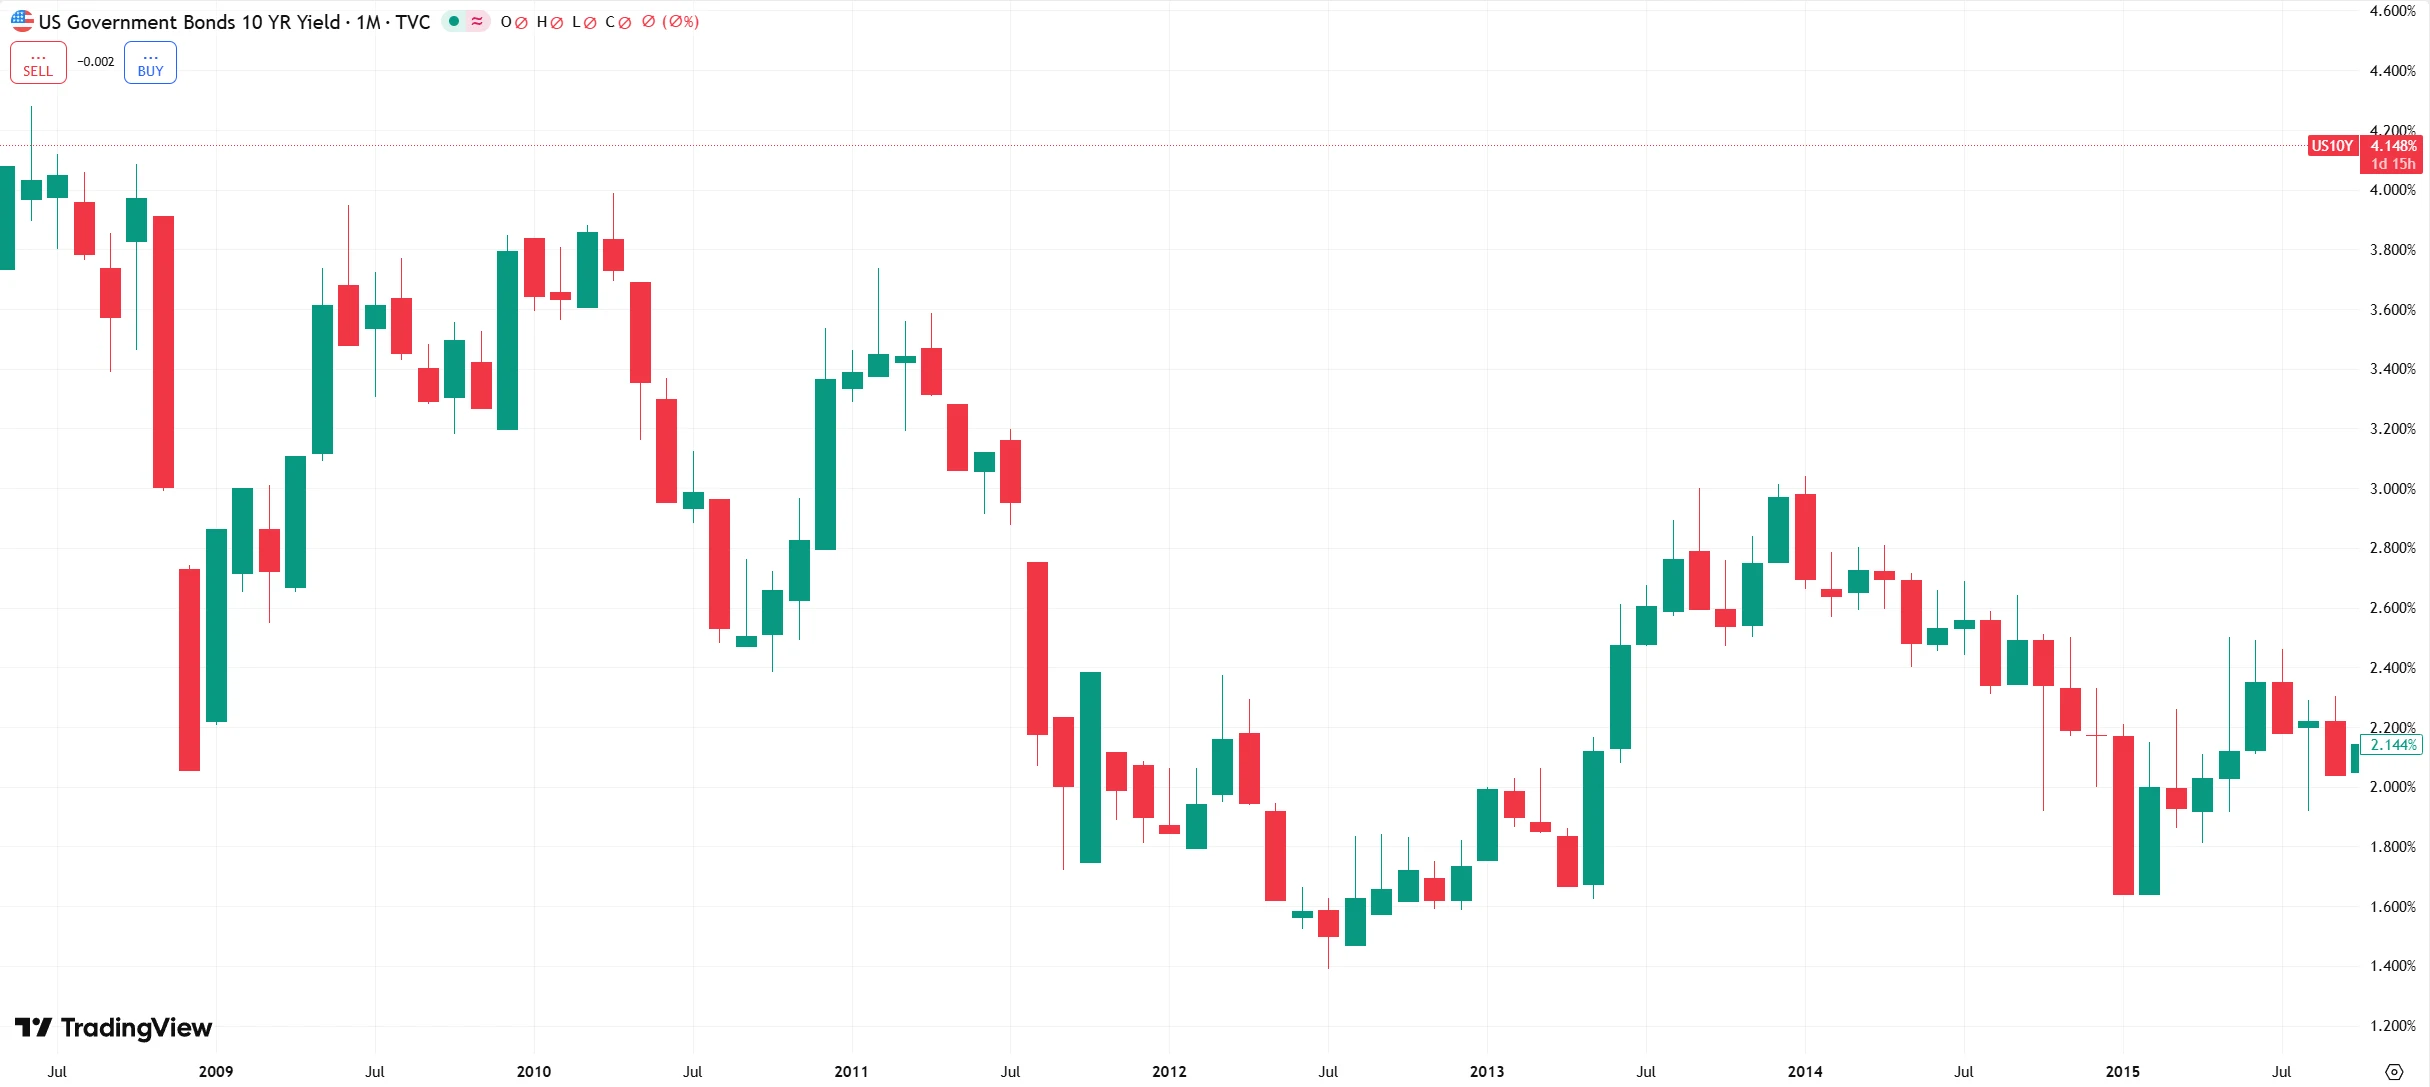
Source: TradingView
In contrast to preemptive easing, crisis-driven cuts rely on gradual policy transmission and market expectation adjustments, resulting in a slower and more lagged decline in rates.
Looking at the present, the 2024–2025 rate-cut cycle has exhibited strikingly different behavior in mortgage rates. Historically, across seven Fed easing cycles since the 1980s, the 10-year Treasury yield has fallen within 100 days of the first rate cut. In the current cycle, however, yields have risen by over 100 basis points in the same period—the first occurrence in 40 years.
Unlike the preemptive or crisis-driven cycles, this unusual behavior is not driven by a single factor but by the combined influence of multiple variables. Consequently, its impact on the yield curve and mortgage rates is deeper and broader, causing a departure from the traditional trajectories observed in prior easing cycles.
Current Cycle Rates
Compared with previous easing cycles, mortgage rates in the current cycle have not declined significantly despite policy loosening; instead, they have remained elevated. This reflects a convergence of multiple constraints: economic growth and inflation have not materially receded, fiscal and policy expectations have heightened uncertainty, and market behavior has further amplified volatility.
U.S. economic growth expectations for 2024 were revised up from 1.4% at the beginning of the year to 2.5%, with actual GDP growth reaching 2.8% for the full year. Consumer spending provided stable support—2024 core PCE price-index–related consumption growth aligned with the pace of economic expansion. While the labor market showed signs of moderation, it did not deteriorate significantly: in August 2024, nonfarm payrolls increased by 142,000, and the unemployment rate stood at 4.2%, indicating continued economic resilience.
At the same time, inflation has remained sticky. Core PCE prices in August 2025 rose 2.9% year-over-year, unchanged from July. Although down from earlier peaks, this remains above the Fed’s 2% target. Atlanta Fed President Bostic publicly forecasted that core inflation would remain around 2.9% through the end of 2025, suggesting that a return to target will require time.
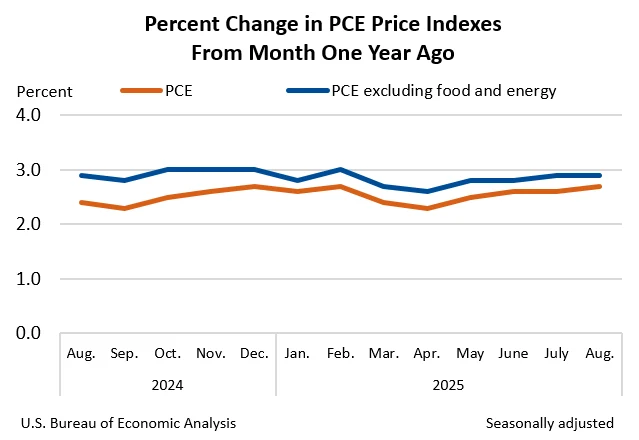
Source: BEA
Overall, robust economic growth has reduced market concerns over a recession, while sticky inflation has elevated long-term inflation premiums. Together, these factors have constrained declines in the 10-year Treasury yield, supporting elevated mortgage rates.
Alongside these economic and inflationary constraints, deteriorating U.S. fiscal conditions have further limited downward pressure on rates. As of June 2025, U.S. federal debt exceeded $36 trillion, equivalent to 123% of GDP. In 2024, interest payments on the national debt surpassed defense spending for the first time, reaching $1.1 trillion, meaning that 19 cents of every federal tax dollar were allocated to servicing existing debt.
In May 2025, Moody’s downgraded the U.S. sovereign credit rating from Aaa to Aa1, citing “massive fiscal deficits and rising interest costs,” which directly fueled market concerns over debt sustainability. Expanding debt has driven a surge in Treasury supply, while demand has contracted: the 10-year U.S. Treasury yield hedged into yen fell to just 0.5%, below the 1.64% yield on 10-year Japanese government bonds, indicating a significant drop in Japanese investor allocation. This supply-demand imbalance has pushed up the term premium, which has risen from -0.3% to 0.8% since 2024, effectively offsetting the downward pressure of policy rate cuts on long-term yields.
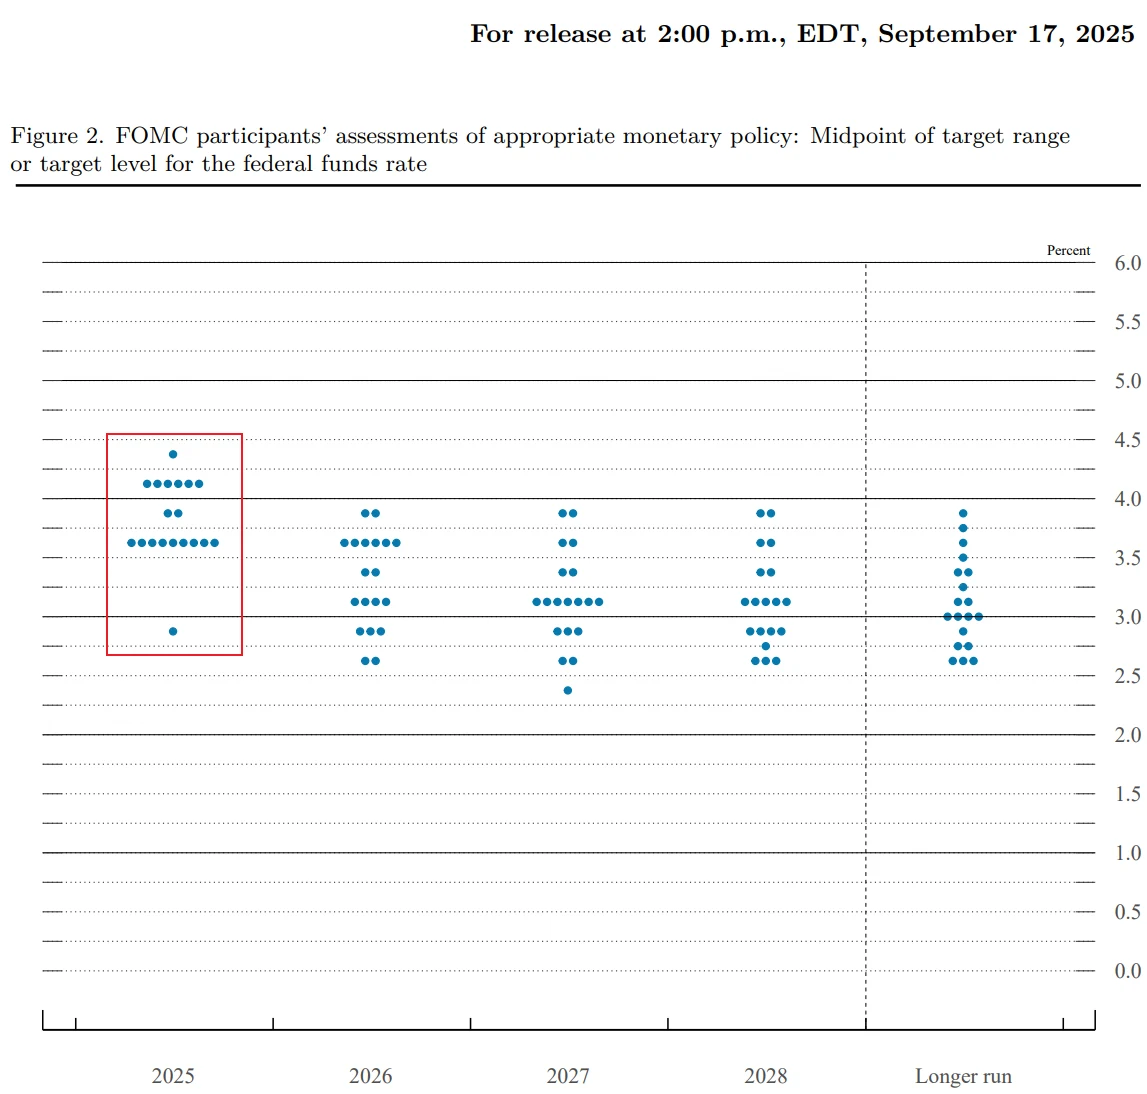
In addition to fiscal risks, policy uncertainty has become another key driver of elevated rates. Following the 2024 U.S. elections, proposed tariff plans by certain campaign teams were interpreted by markets as potentially inflationary. At the September 2025 FOMC meeting, Fed officials exhibited notable divergence on the path of rate cuts: of 19 members, 9 expected only one more cut or fewer in 2025, 9 expected two more cuts (totaling 50 basis points), and 1 expected as many as five cuts. Such internal disagreement has blurred policy signals, making it difficult for the market to form a unified long-term rate outlook and contributing to greater volatility in the 10-year Treasury yield.
Source: Federal Reserve
Beyond these macro and policy factors, market behavior has further amplified rate fluctuations. Fed rate cuts are often priced in advance. Ahead of the September 2025 rate cut, CME FedWatch data showed the market-implied probability at 92%, prompting investors to buy Treasuries early, pushing yields down. However, once the cut was implemented, some investors took profits, selling Treasuries and causing yields to rebound. Consequently, the 30-year mortgage rate remained near 6.3%. This “buy the rumor, sell the fact” dynamic often leads rates to move counter to the policy direction when the action actually occurs.
Projected Rates in a Rate-Cut Scenario
As market focus on a potential Fed policy shift intensifies, the October FOMC meeting has become a key reference point for investors assessing the trajectory of interest rates.
According to CME FedWatch data, the market-implied probability of a 25-basis-point rate cut in October stands at 89.3%, with only a 10.7% chance of rates remaining unchanged. The likelihood of a cumulative 50-basis-point cut by December is 66.4%. Wall Street institutions, including Goldman Sachs, project that the Fed will cut 25 basis points in both October and December, followed by two additional cuts in 2026, ultimately bringing the federal funds rate to a 3.0%-3.25% range.
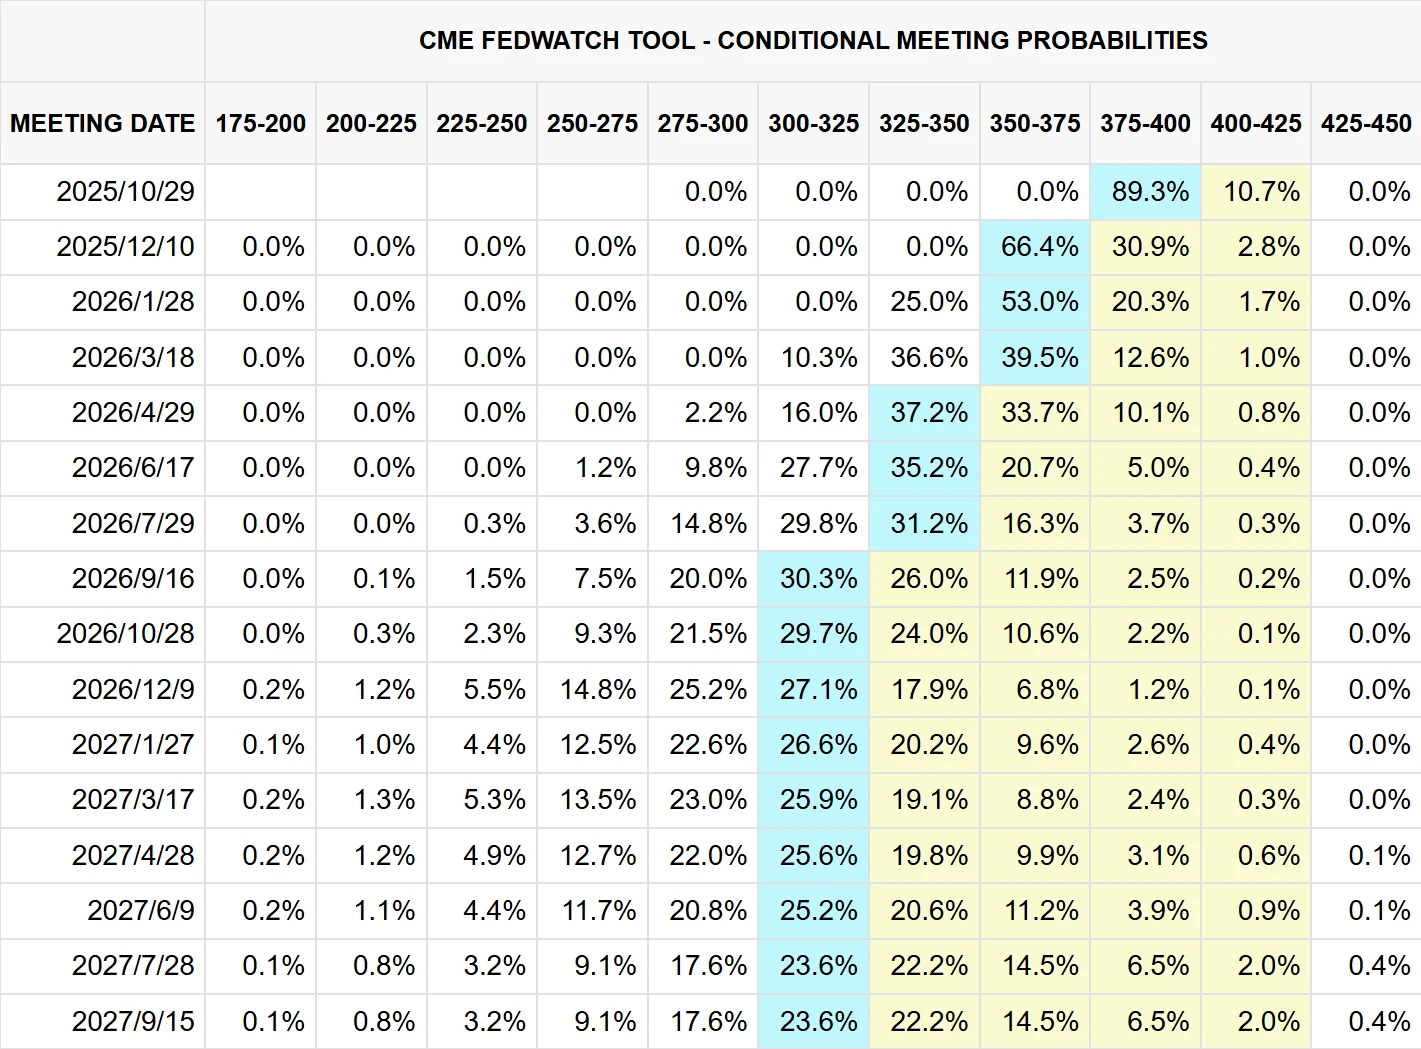
Source: CME Group
However, hawkish voices within the Fed cannot be overlooked. Atlanta Fed President Bostic has stated that there is “not much justification for further cuts at this time,” expecting only one rate reduction in 2025. St. Louis Fed President Bullard also emphasized that the scope for additional easing is limited, warning that persistent cuts could trigger an inflation rebound. Such internal divergence introduces significant uncertainty regarding the pace of future cuts, thereby dampening their potential downward impact on long-term rates.
Against this backdrop, even if the Fed delivers the expected October cut, mortgage rates are unlikely to decline substantially, and are expected to trade in the 6.2%-6.5% range.
Three key factors underpin this outlook: first, the 10-year Treasury yield has limited downside. Research from Shenwan Hongyuan Securities notes that the U.S. nominal natural rate lies in the 3.0%-3.5% range, constraining the potential decline in long-term yields, with the 10-year Treasury expected to stabilize around 4.0%-4.2%. Second, fiscal deficits and debt supply pressures are unlikely to ease in the near term. Moody’s projects that the federal deficit-to-GDP ratio will rise from 6.4% in 2024 to nearly 9% by 2035, likely sustaining upward pressure on the term premium. Third, inflation remains sticky. Fed Chair Powell has publicly acknowledged that “rising commodity prices will continue to fuel inflationary pressures,” leaving markets concerned about long-term inflation.
Mortgage rates are unlikely to see material declines unless extreme conditions emerge, such as core PCE inflation staying below 2.5% for three consecutive months, a sharp deterioration in the labor market (monthly nonfarm payrolls below 10,000), or global geopolitical risks triggering a flight to safety into Treasuries.
Final Thoughts
The decoupling of mortgage rates from Fed policy essentially reflects the market’s integrated pricing of long-term economic fundamentals and policy credibility. In the current cycle, the combination of resilient growth, sticky inflation, fiscal expansion, and quantitative tightening (QT) has rendered long-term yields largely “immune” to rate cuts. If inflation remains above the 2% target and the labor market shows no significant deterioration, mortgage rates are likely to stay above the 6% range.
For policymakers, this calls for a reassessment of the effectiveness of monetary policy transmission to the housing market. For market participants, it suggests moving beyond the linear assumption that “rate cuts automatically lower mortgage rates” and instead focusing on more fundamental drivers, such as the 10-year Treasury yield curve, government debt issuance plans, and inflation expectations.
Disclaimer: The content of this article does not constitute a recommendation or investment advice for any financial products.

Email Subscription
Subscribe to our email service to receive the latest updates
