U.S. Stocks Extend Their Decline — What Comes Next?
![]() FoolBull
FoolBull
23:25 September 24, 2025 EDT
U.S. equities continued to decline.
As of the close on September 25, the Dow Jones Industrial Average fell 0.37% to 46,121.28, the S&P 500 lost 0.28% to 6,637.97, and the Nasdaq slipped 0.33% to 22,497.86, marking the second consecutive day of losses. The Dow has now given back all of the gains made following the Federal Reserve’s September policy meeting.
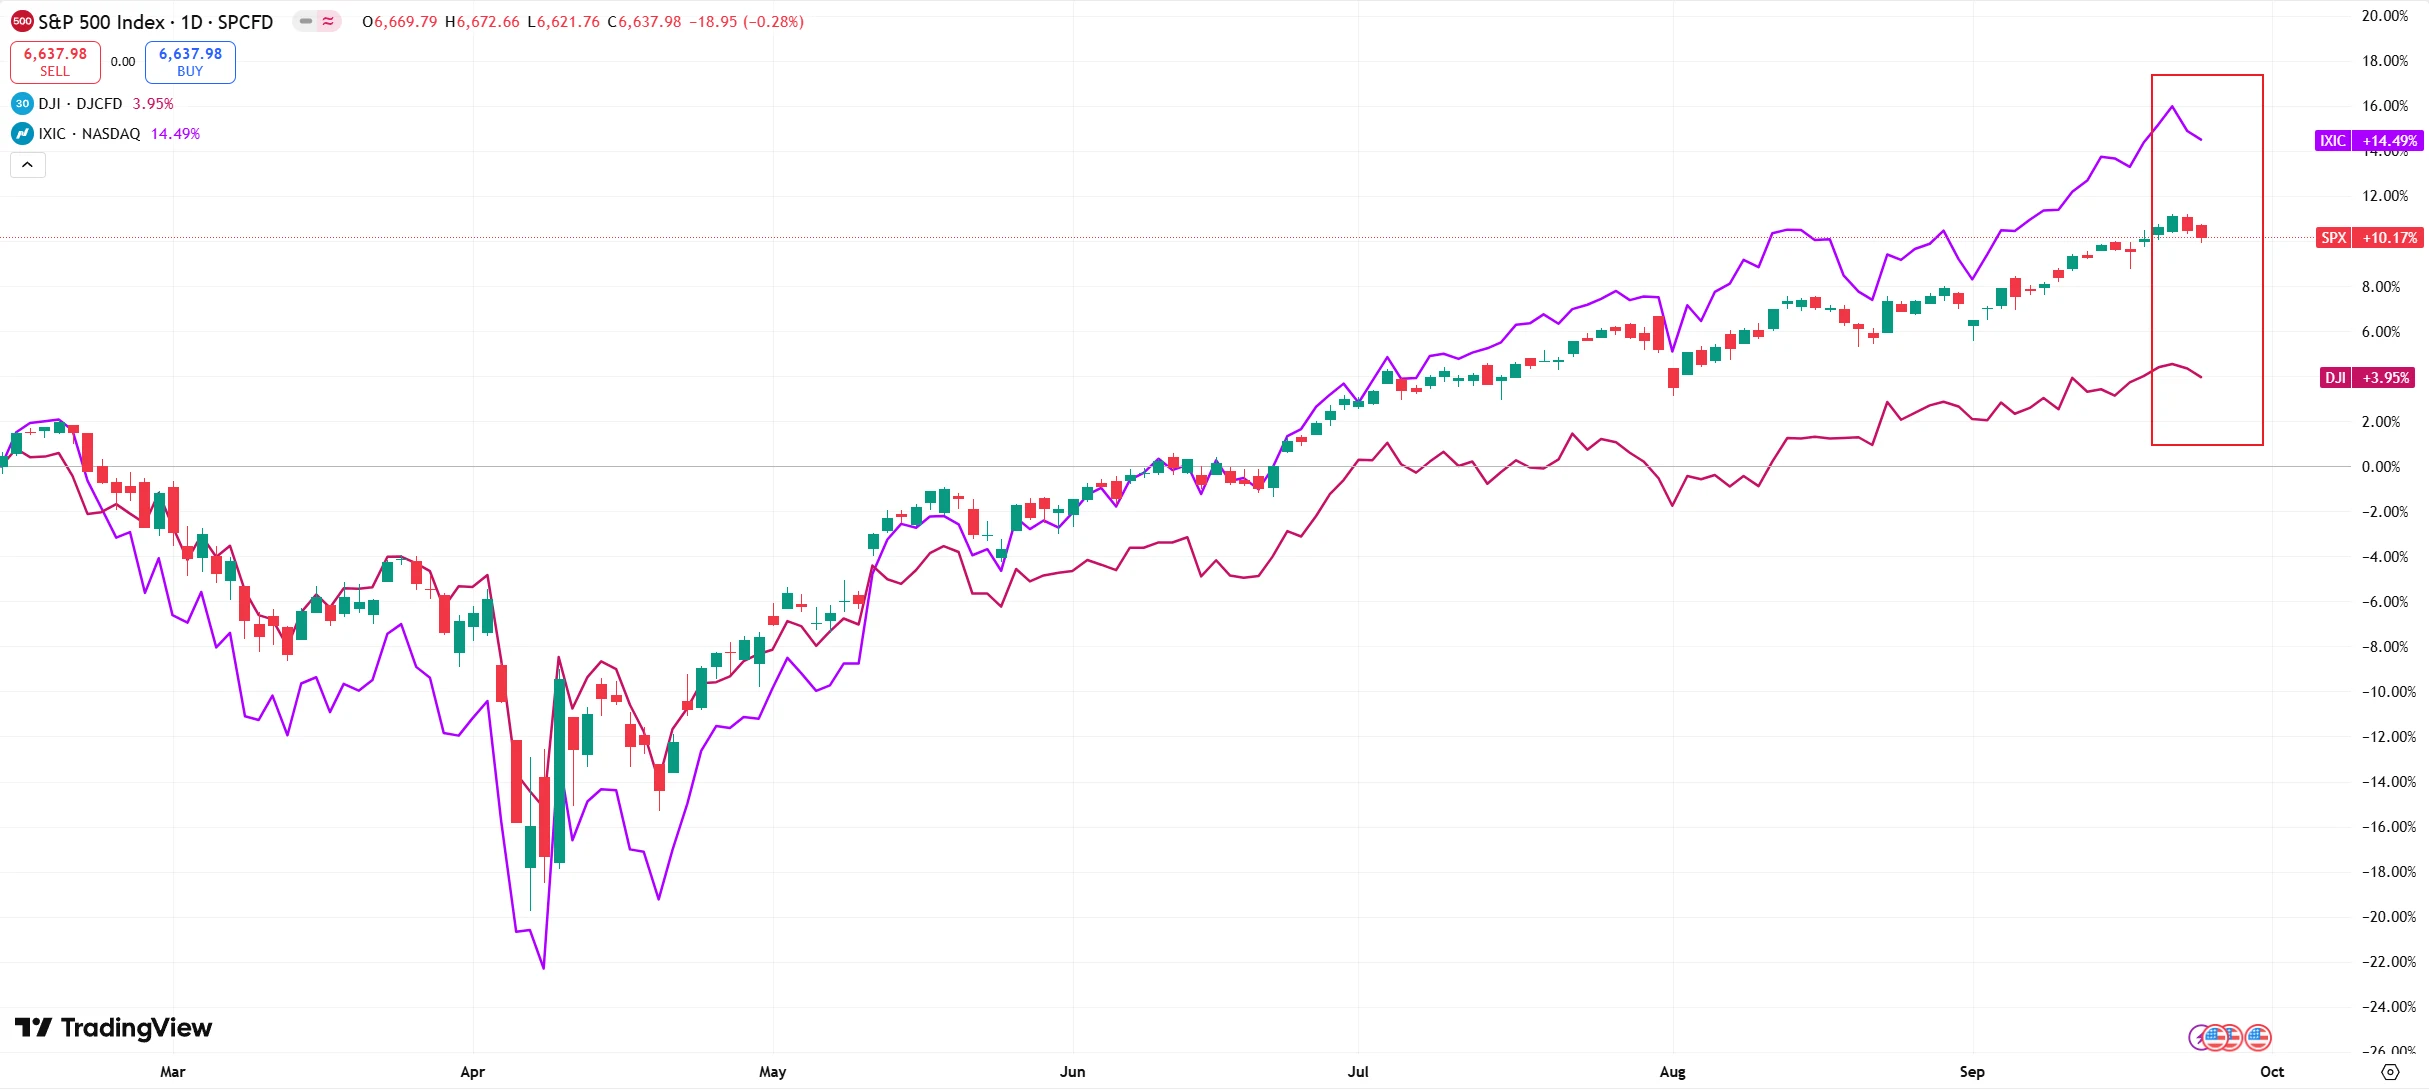
Source: TradingView
From a market dynamics perspective, the current pullback is being driven by clear factors: risks accumulated at elevated valuations, uncertainty around the Fed’s policy trajectory, pressure from macroeconomic fundamentals, and a shift in investor sentiment—all combining to form the core catalysts for the correction.
At the same time, market participants remain divided over the nature of this adjustment. Some see it as a short-term technical consolidation, while others worry that the market’s trend momentum is fading. If these core drivers fail to improve, the correction could extend further.
Overall Market Performance
After a sharp rally, U.S. equities showed signs of fatigue this week, with the three major indexes extending their declines and large-cap tech stocks bearing the brunt of the selloff. Oracle plunged more than 4%, Amazon fell over 3%, and Nvidia lost nearly 3%.
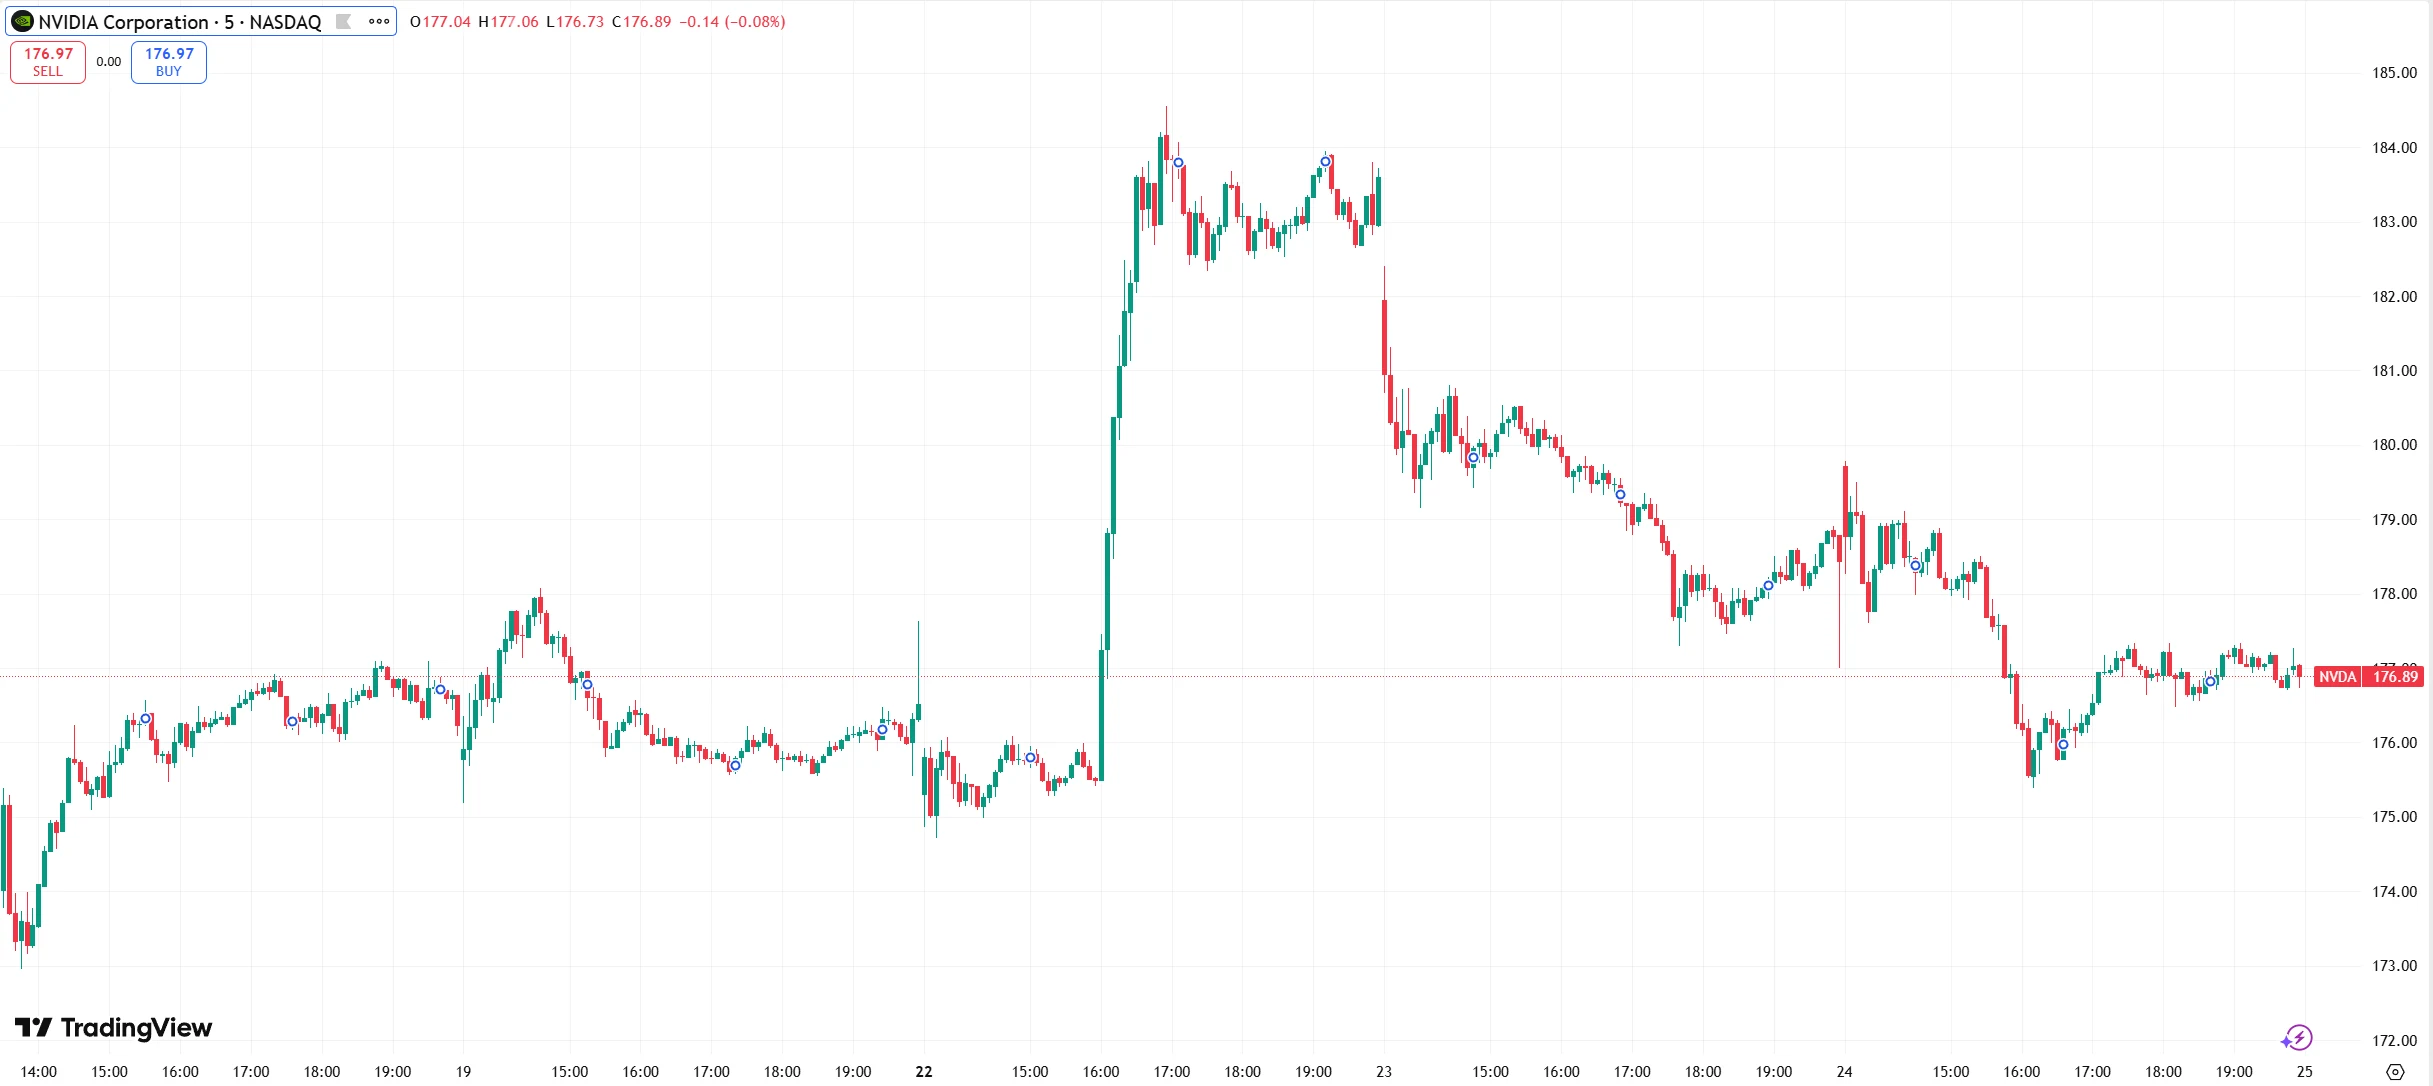
Source: TradingView
The VIX, Wall Street’s so-called “fear gauge,” had been hovering at low levels but has recently started to trend higher. It has climbed from 14.12 at the end of last month to 16.18 currently. While still low by historical standards, the upward momentum is noteworthy. Options market data indicate that investors are stepping up hedges against volatility.
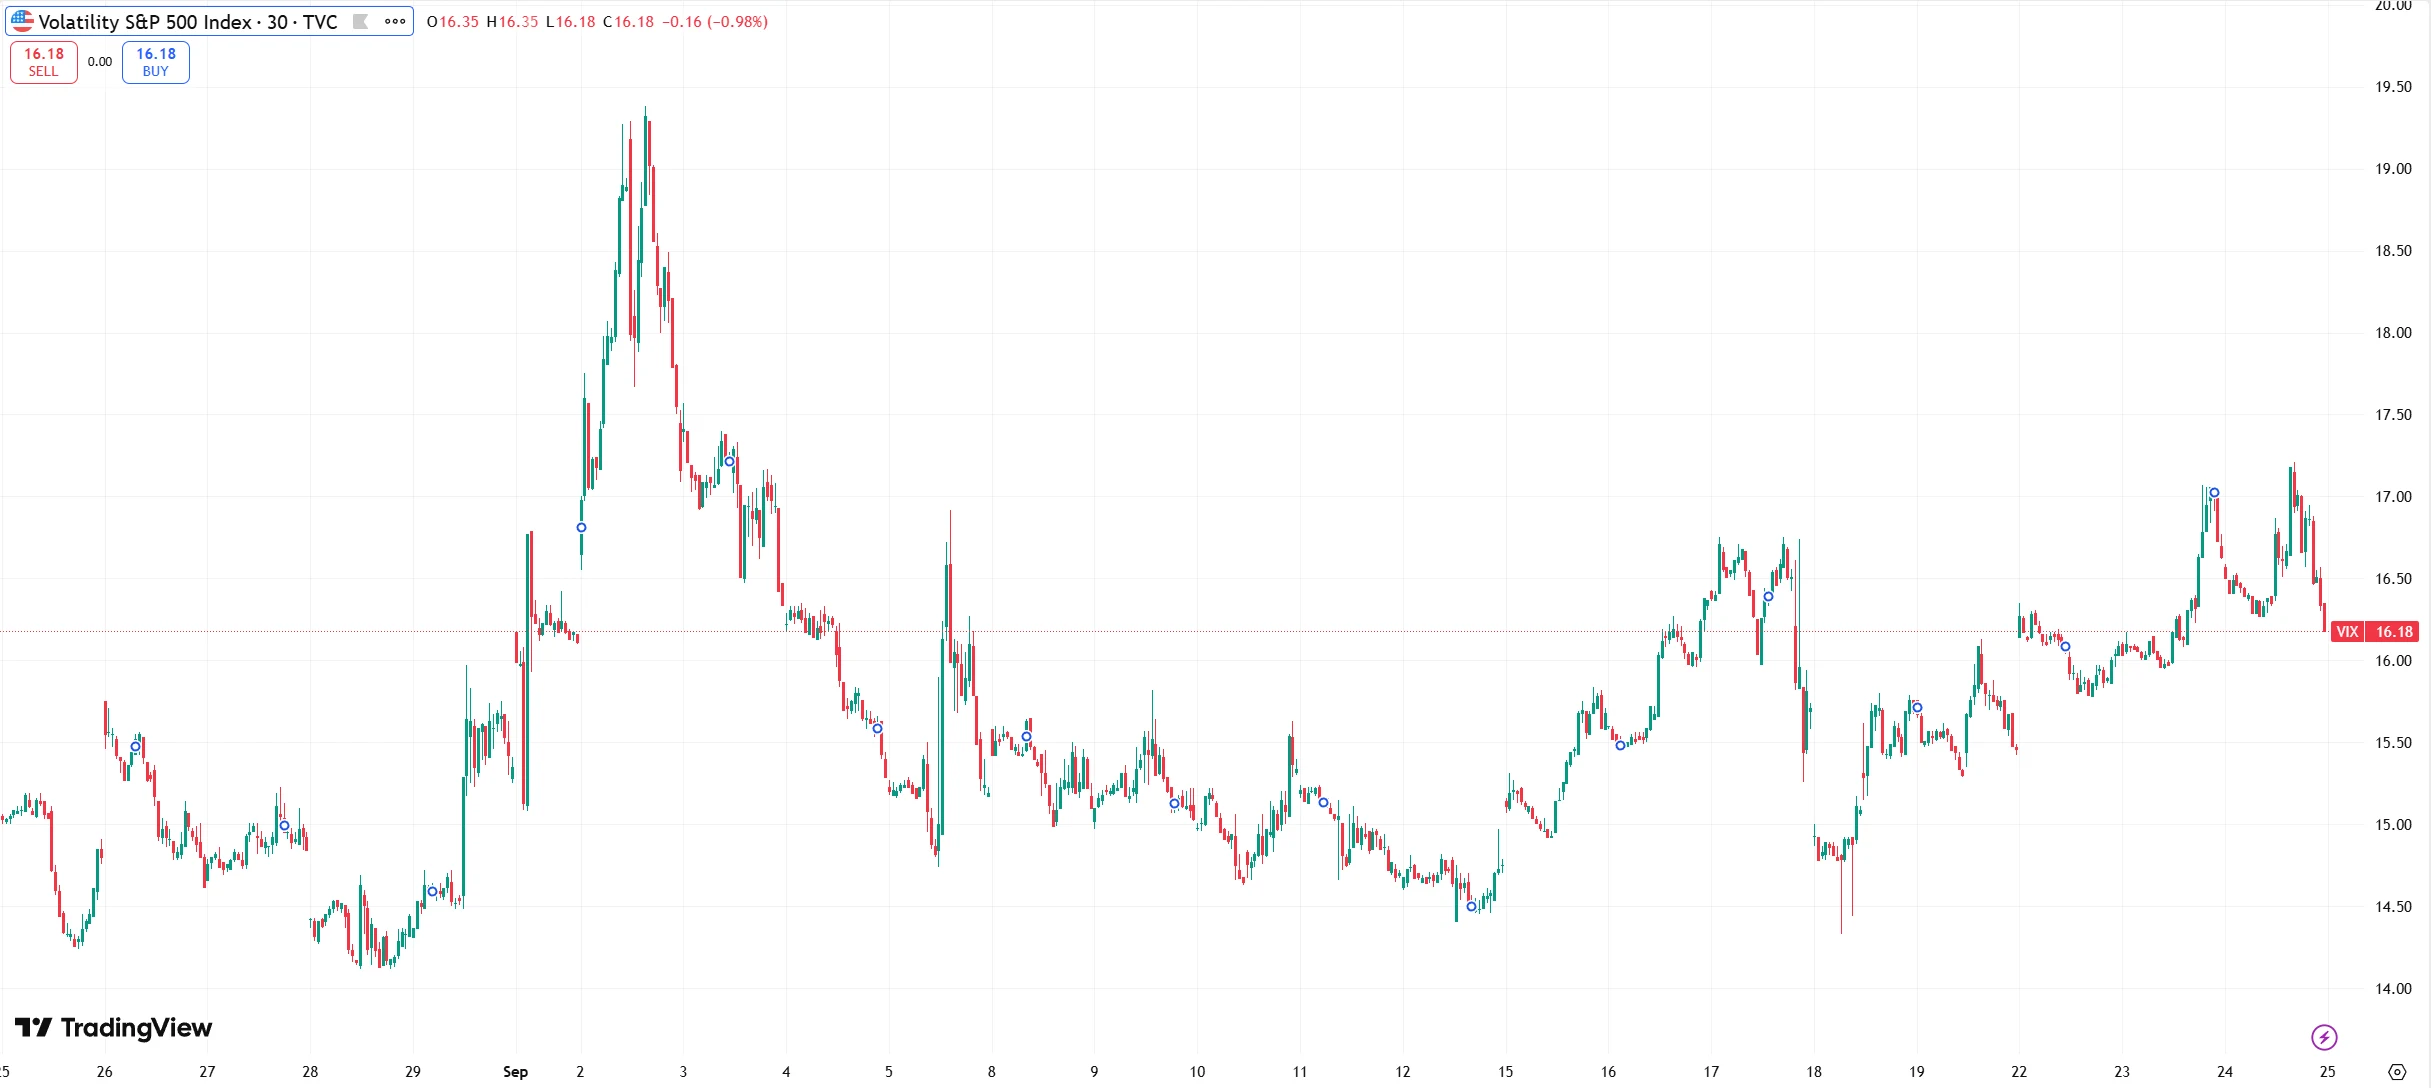
Source: TradingView
In stark contrast to U.S. equities, safe-haven assets have strengthened. Gold prices rallied, with COMEX gold futures rising 0.58% to $3,796.9 per ounce, while spot gold briefly broke above $3,790 per ounce to hit a record high. The U.S. dollar index also advanced, underscoring the shift in risk sentiment.
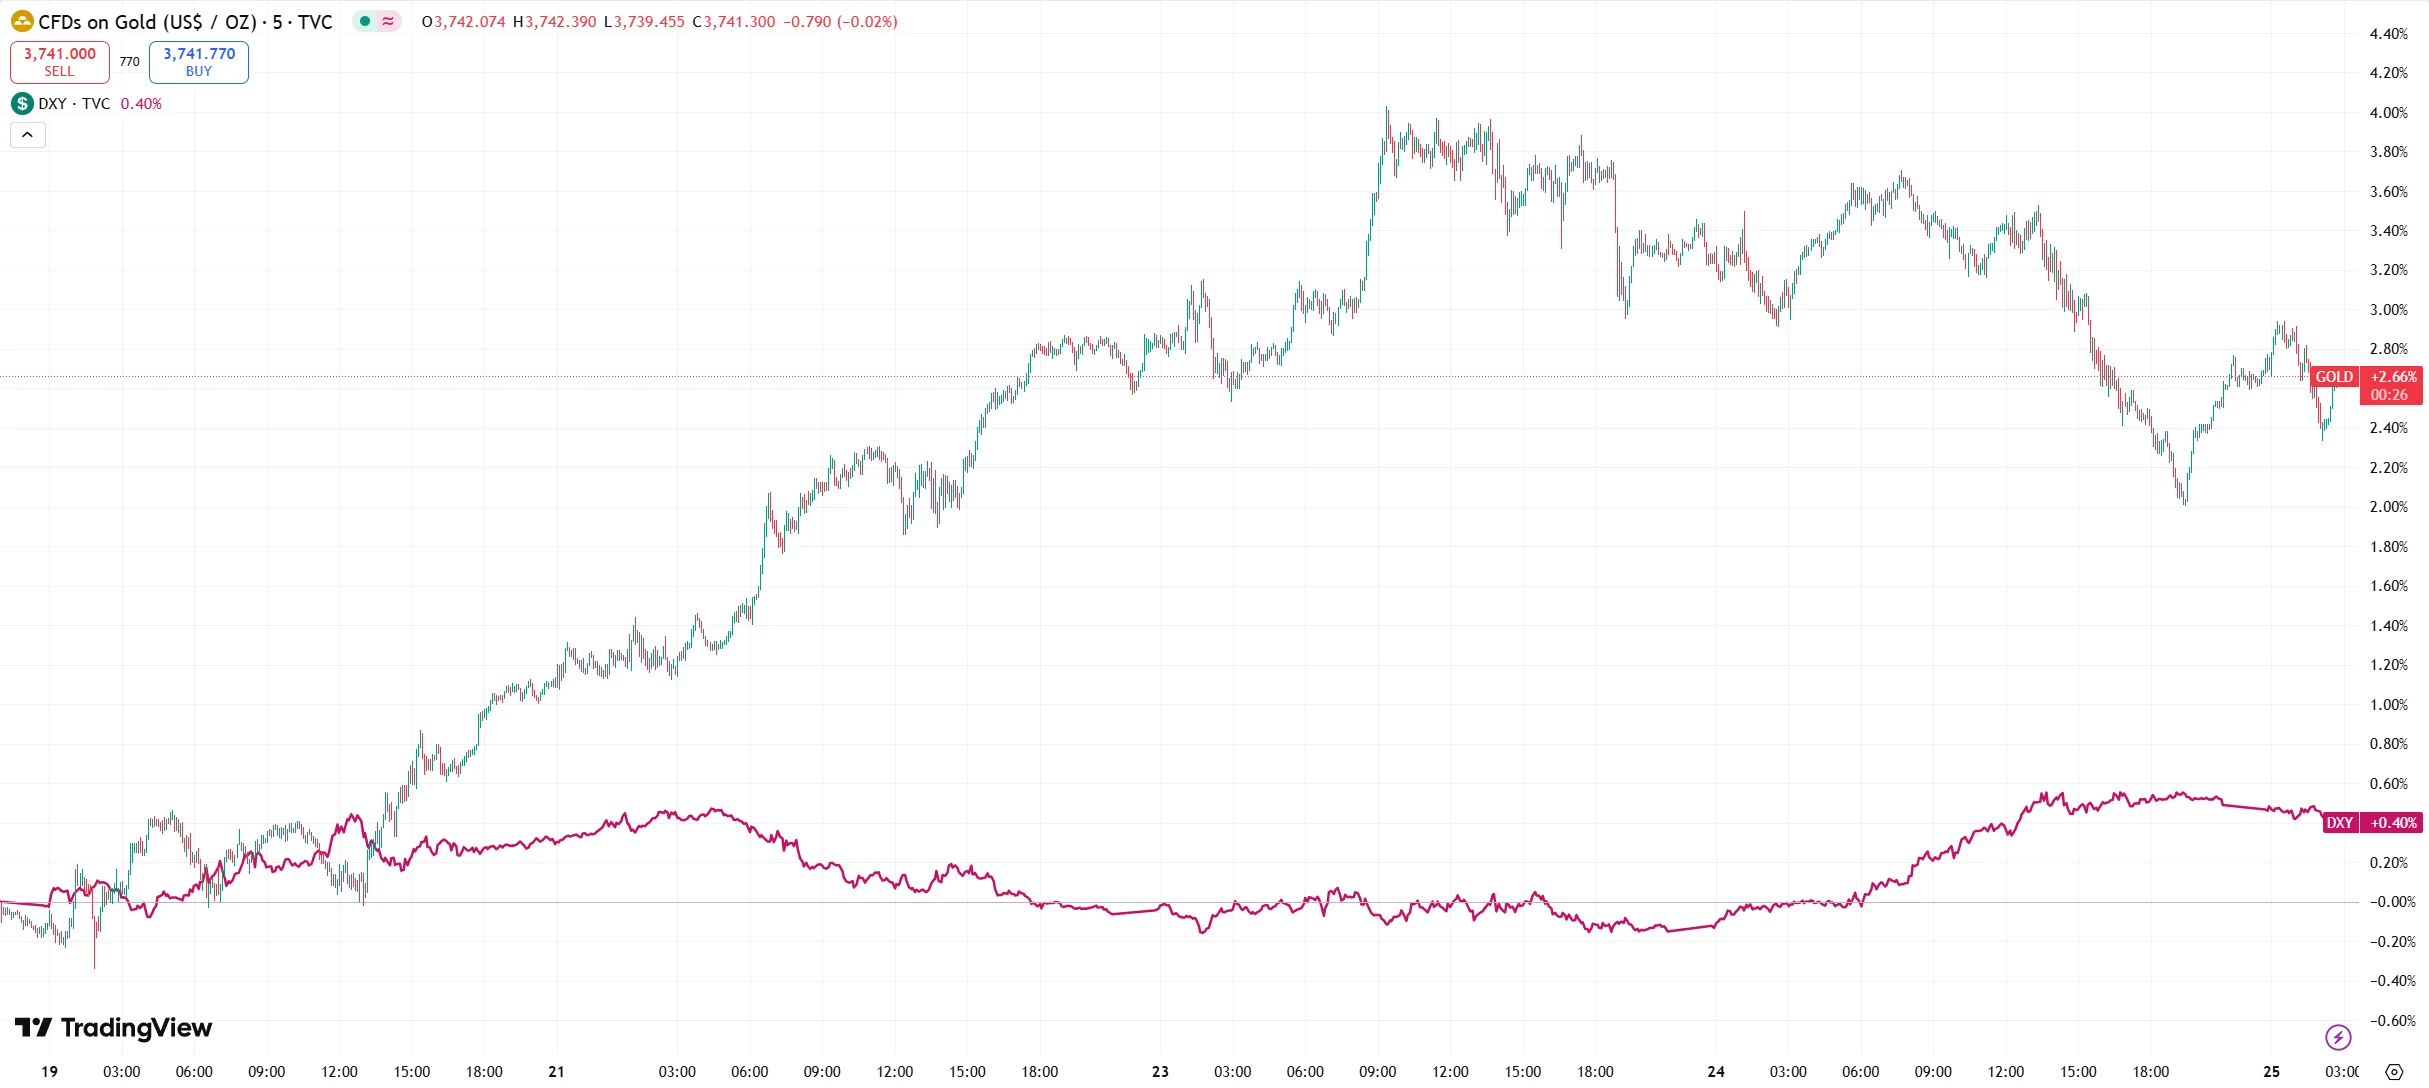
Source: TradingView
On the flow side, U.S. equity funds saw net outflows of $43.19 billion in the week ended September 17—the largest weekly withdrawal since mid-December 2024, when outflows reached $50.62 billion. Meanwhile, as of September 21, money market fund assets swelled to $7.7 trillion, with more than $60 billion flowing in during just the first four days of September.
Valuation Alert
Stretched valuations have emerged as the primary catalyst behind the latest U.S. equity correction, with multiple metrics pointing to historically elevated levels.
According to research by Savita Subramanian, strategist at Bank of America, 19 of the 20 valuation indicators she tracks show U.S. benchmark indexes trading at statistically expensive levels. The S&P 500’s 12-month forward price-to-earnings ratio climbed to 22.9x this week—a level surpassed only twice this century: during the dot-com bubble in the early 2000s and in the summer of 2020 amid the Fed’s zero-rate policy.
Within sectors, the “Magnificent Seven” (Tesla, Alphabet, Apple, Meta, Amazon, Microsoft, and Nvidia)—the primary drivers of the rally—are showing increasing valuation dispersion. While Bank of America strategist Michael Hartnett’s team noted that the group’s 223% gain since the March 2023 trough remains below the 244% average peak of past bubble cycles, and its current 39x trailing P/E is lower than the 58x recorded during previous crashes, individual disparities are striking. Tesla, for example, is expected to see 2025 earnings drop nearly 30% year over year, yet its forward P/E still stands at a lofty 155x—far above Nvidia’s 31x—making it the most exposed to valuation risk among the group.
Broader market valuation metrics are no less concerning. The so-called “Buffett Indicator” (total U.S. market cap relative to GDP) is hovering around 200%, not only above the 150% peak reached during the dot-com bubble in early 2000 but also higher than the 180% level seen on the eve of the Great Depression in 1929. The Shiller P/E ratio, which adjusts earnings over a 10-year inflation-adjusted period, has risen to 37.5x—above the 32.6x level before the Depression, and second only to the 44.2x peak of the dot-com era.
On September 23, Fed Chair Jerome Powell openly acknowledged that “by many metrics, U.S. equity valuations are quite high.” His rare departure from the Fed’s usual reluctance to comment directly on valuations sparked a sharp selloff in technology stocks that day—the Nasdaq 100 fell nearly 1%, with Amazon and Nvidia each dropping more than 2%.
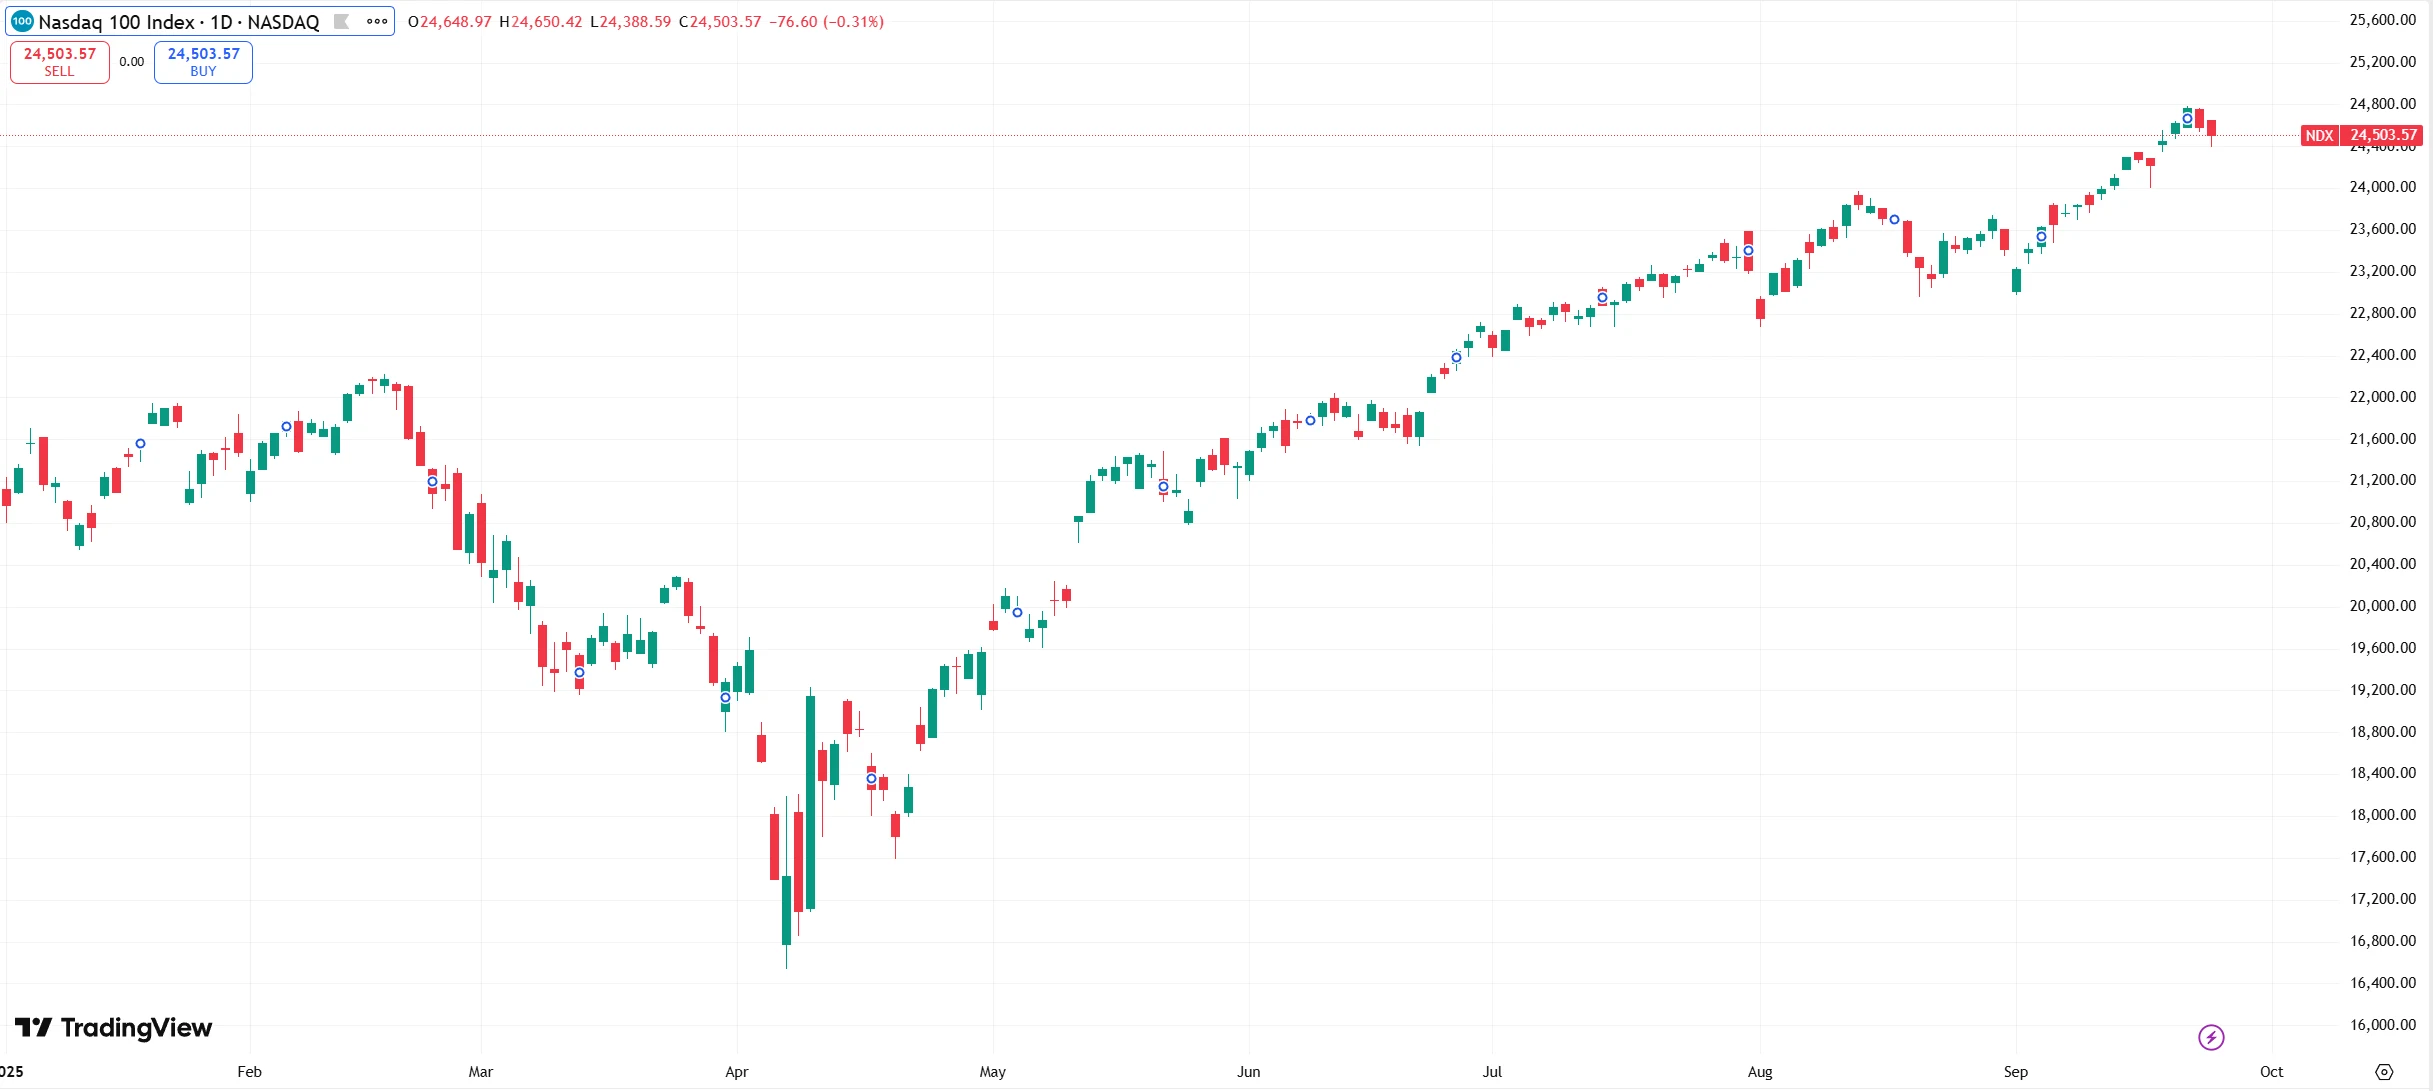
Source: TradingView
Fed Policy Expectations Misaligned
The trajectory of the Federal Reserve’s monetary policy has always been a key driver of U.S. equity performance. Following the September FOMC meeting, the ambiguity in policy signals contrasted sharply with aggressive market expectations, emerging as one of the direct triggers behind the recent string of market declines.
As expected, the September FOMC lowered the policy rate by 25 basis points to 4.0%–4.25%. The accompanying dot plot indicated room for two additional rate cuts this year, with one more expected in 2026, bringing the policy rate down to a projected 3.25%–3.50%.
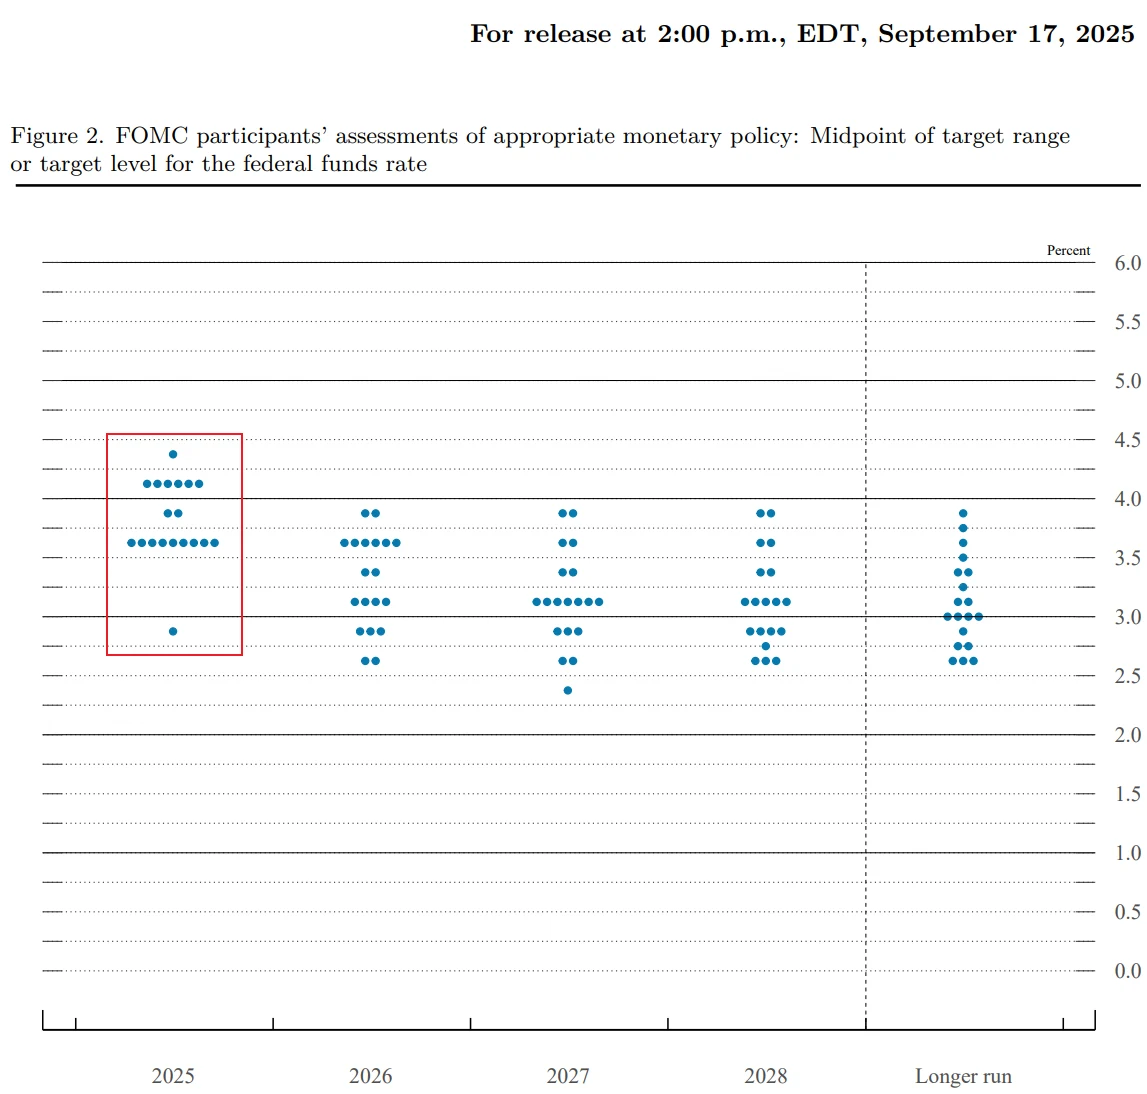
Source: Federal Reserve
However, market bets on easing have far outpaced official Fed guidance. According to LSEG data, futures markets currently price the Fed’s benchmark short-term rate to fall below 3% by the end of 2026—well below the current level slightly above 4% and under the Fed’s median projection of 3.4%. CME FedWatch data further shows that, as of September 25, the market assigns a 91% probability to a 25-basis-point cut in October and nearly an 80% probability for another 25-basis-point cut in December.
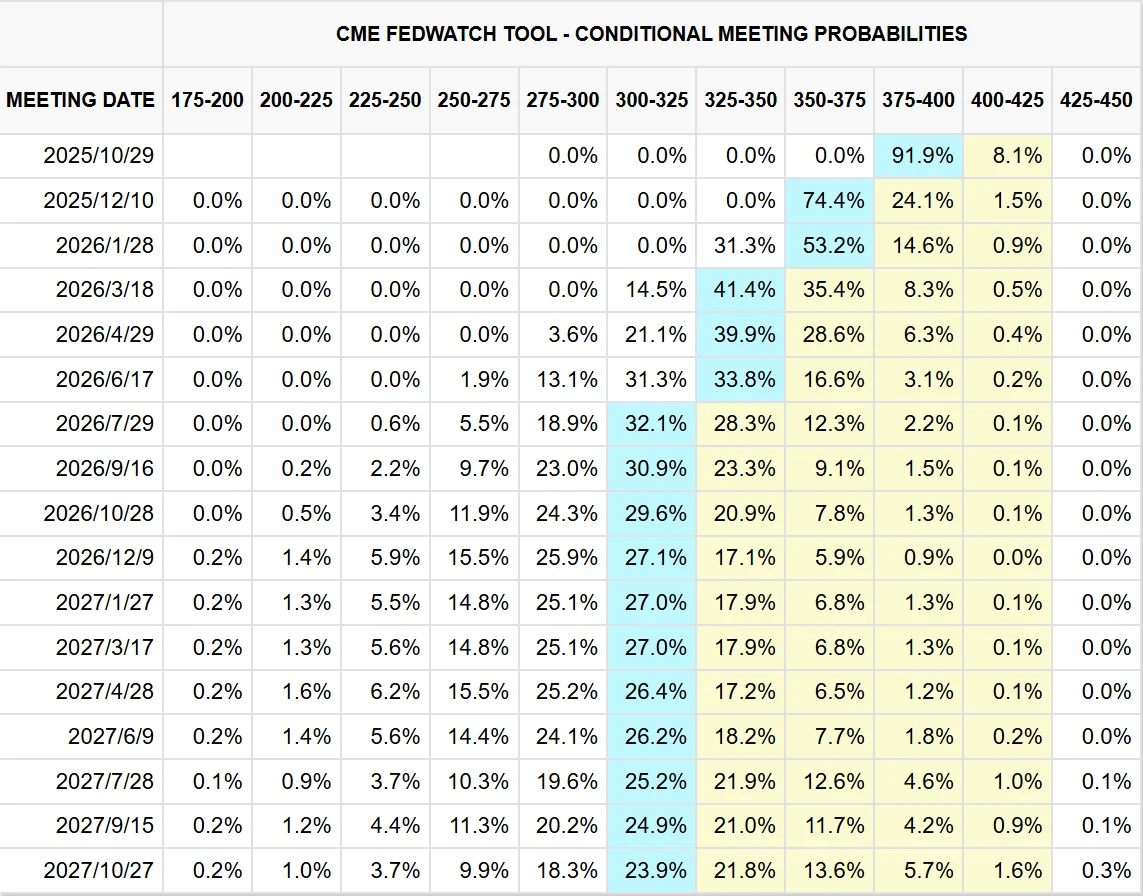
Source: CME Group
This misalignment of expectations was further highlighted during Fed Chair Jerome Powell’s September 23 public remarks. Powell emphasized that the September rate cut represented a shift from a “restrictive” to a “neutral” stance, rather than the start of a full easing cycle. Future policy adjustments will have “no preset direction” and will be evaluated on a meeting-by-meeting basis according to economic data. He also stressed that current rates remain “moderately restrictive” and that further cuts would only be considered if a significant labor market slowdown were to outweigh upside inflation risks.
Policy divergence within the Fed has compounded market uncertainty. Newly appointed Fed Governor Stephen Milani, nominated by the Trump administration, publicly stated after the September meeting that the U.S. economy has “entered a moderate slowdown” and advocated accelerating rate cuts by 50 basis points per meeting until reaching the neutral rate range of 2.5%–3%, contrasting with the more cautious stance of most other members. Meanwhile, the Trump administration has repeatedly criticized the Fed for “cutting rates too slowly” and even suggested “pausing balance sheet reductions to release liquidity,” undermining confidence in the Fed’s independence and policy stability.
Adding to the challenge, the current combination of slowing employment and sticky inflation—a “quasi-stagflation” scenario—has left the Fed in a policy bind. Accelerating rate cuts to support employment could risk reigniting inflation, while maintaining restrictive policy may deepen the economic slowdown. Market confidence in a soft landing is waning. Preliminary data from the University of Michigan shows the September U.S. consumer sentiment index fell to 55.4, down 4.8 points from August and 21% year over year.
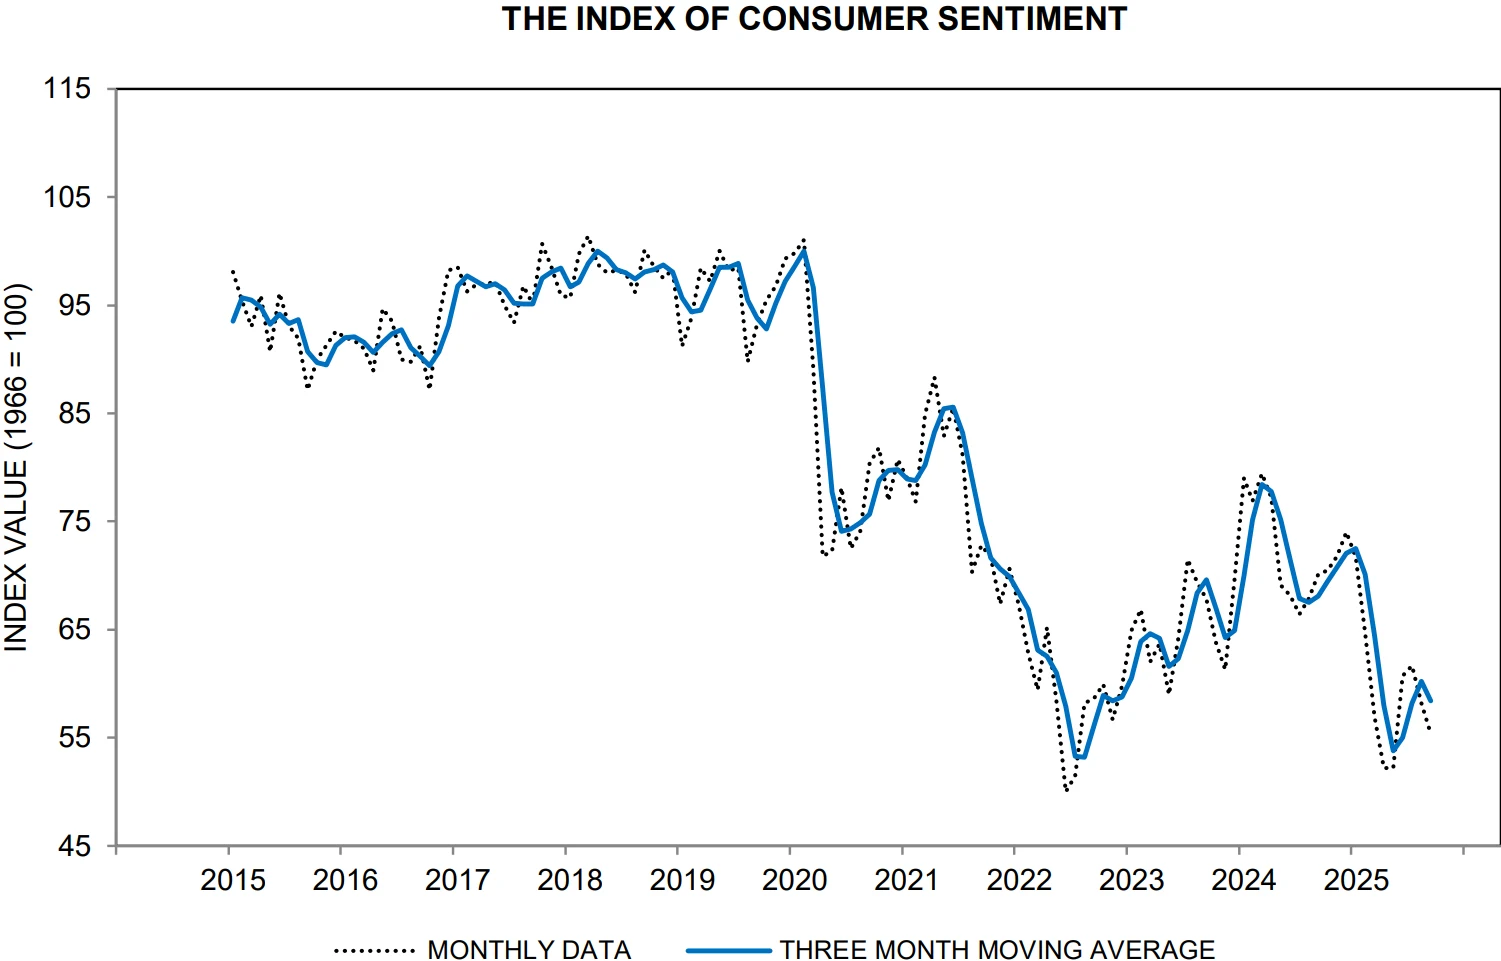
Source: University of Michigan
Short-Term Pullback and Trend Debate
Wall Street institutions are offering sharply divergent outlooks for U.S. equities. Optimists view the recent selloff as a healthy market correction. Andrew Tyler, strategist at JPMorgan, noted that his clients believe “the most likely thing to derail this bull market is an asteroid hitting the Earth,” reflecting continued institutional confidence in fundamentals.
Goldman Sachs has raised its 12-month S&P 500 target to 7,200, implying roughly 8% upside. The firm argues that if the U.S. economy avoids a recession, corporate earnings growth should support current valuations. Goldman projects S&P 500 earnings per share (EPS) to rise 8% in 2025, reaching $285.
However, cautionary voices remain strong. Daniel Skelly, head of market research at Morgan Stanley Wealth Management, stated that while there are reasons to doubt “bubble narratives,” investors should remain vigilant. The firm recommends clients increase portfolio defensiveness, boosting allocations to cash and high-quality bonds.
Bank of America takes an even more conservative stance. Its latest fund manager survey shows cash allocations rising to 4.8%, above the 4.5% historical average, signaling a decline in professional investors’ risk appetite. The bank suggests that the phase of valuation expansion may be over.
A key point of debate centers on whether corporate earnings growth can sustain high valuations. FactSet data indicate that analysts expect S&P 500 EPS to rise 14.8% in 2025, though these forecasts face downside risk.
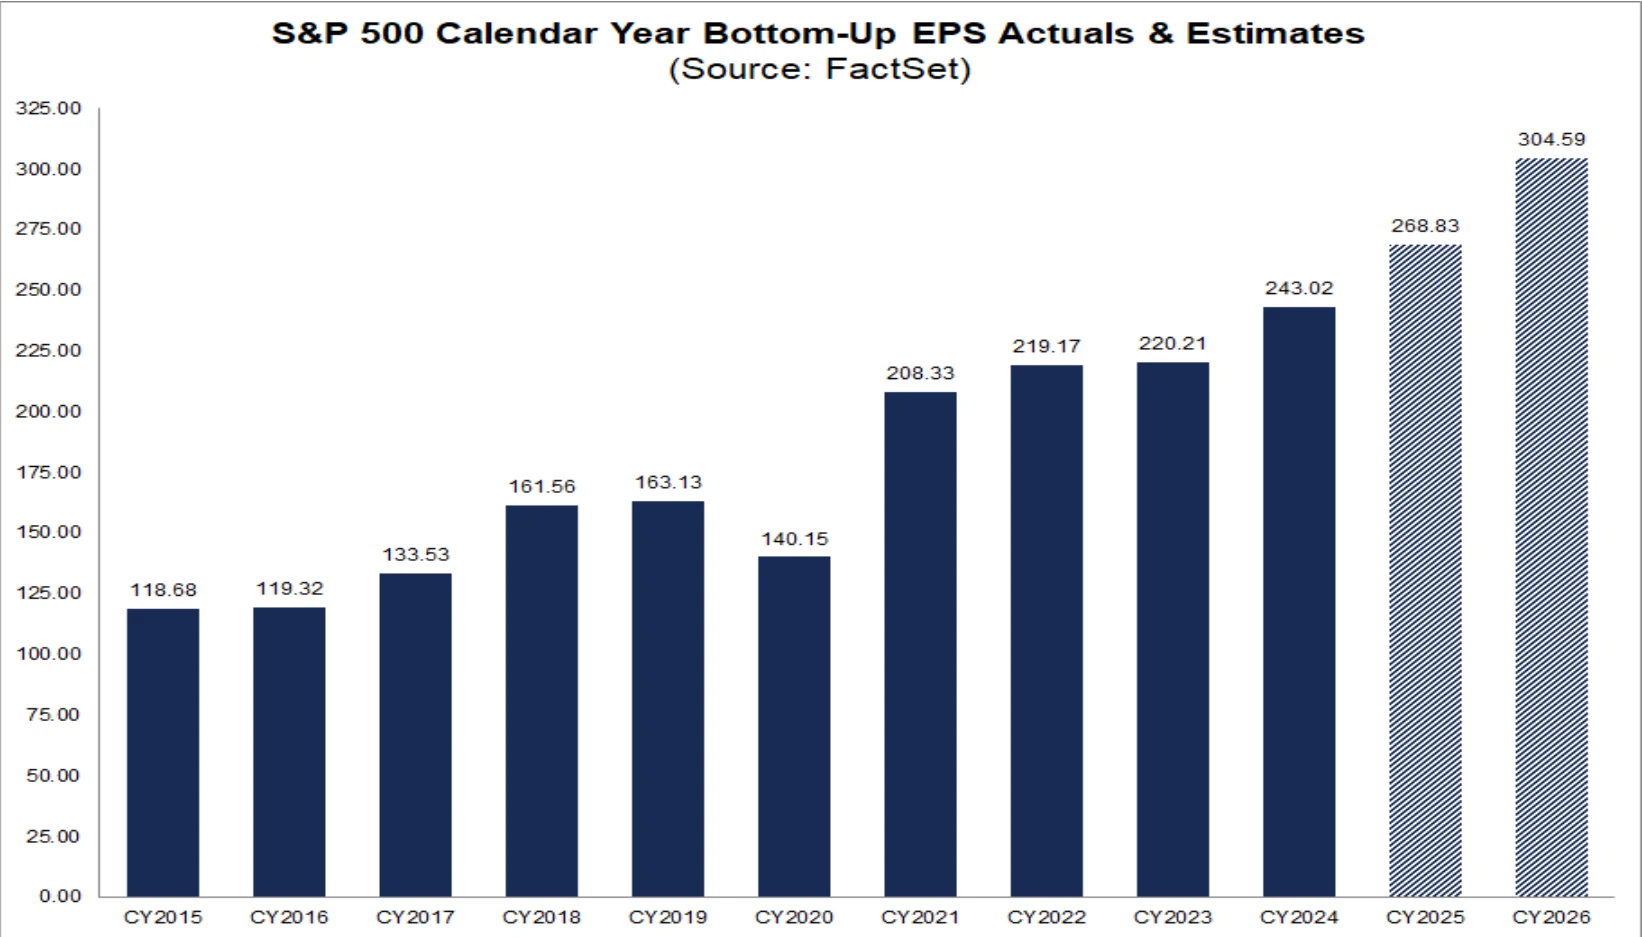
Source: FactSet
Looking at sector-level trends, the technology sector is expected to see 13.2% earnings growth in 2025, above the broader market average. However, growth projections for semiconductors and hardware equipment have begun to decelerate, with some companies issuing next-quarter guidance below market expectations.
Macro conditions also pose challenges for corporate profitability. The recent strength of the U.S. dollar may weigh on multinational firms’ foreign revenue conversions, while rising labor costs continue to pressure margins. Goldman Sachs estimates that, all else equal, each 100-basis-point change in labor costs would impact S&P 500 EPS by 0.7%.
Keith Parker, analyst at UBS, noted that “the breadth of earnings revisions is deteriorating.” Among S&P 500 constituents, the number of companies lowering guidance exceeds those raising it. If this trend continues, it could trigger a market-wide repricing of earnings expectations.
Historical Comparison
Comparing the current market environment with historical periods of elevated valuations provides useful perspective.
Relative to the 2000 dot-com bubble, today’s tech leaders are markedly more profitable. The S&P 500 Technology Index posts a net profit margin of 28%, well above the 16% seen in 2000. Market structure has also evolved: the current U.S. equity market is more evenly distributed across sectors, with healthcare and energy seeing higher weightings, which somewhat mitigates the impact of tech-sector volatility on the broader market. In addition, the growing share of passive investment may have altered the characteristics of market swings.
Compared with the post-pandemic rebound in 2020, the monetary policy backdrop today is starkly different. Back then, the Fed’s balance sheet expansion hit record levels, whereas today the central bank is implementing quantitative tightening, shrinking its balance sheet by $40 billion per month.
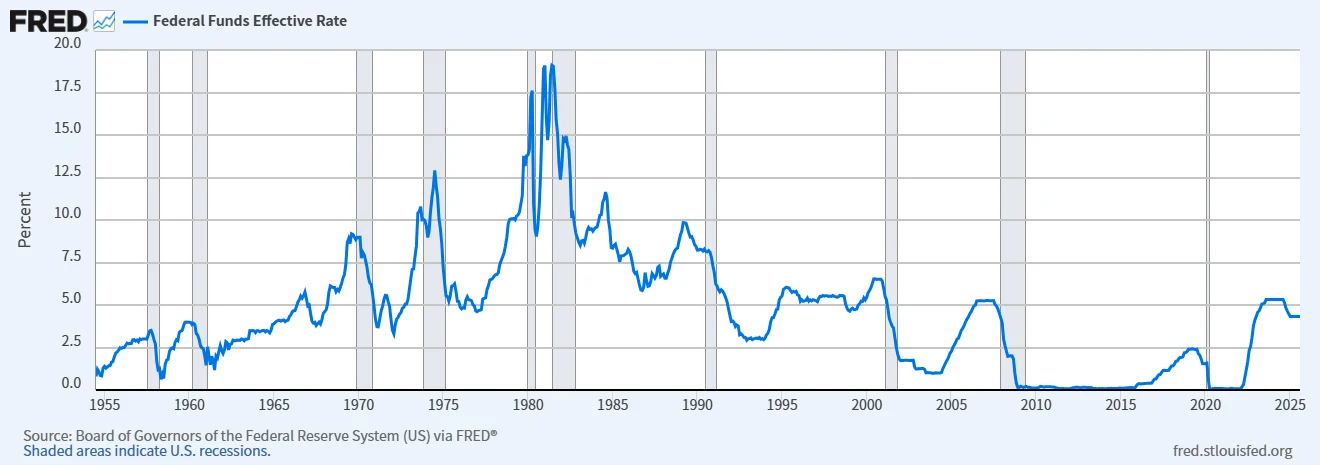
Source: FRED
Notably, retail investor participation remains elevated relative to historical averages. Retail trading accounts for roughly 18% of total market volume, close to the levels seen during the 2021 meme-stock frenzy. This may lead to heightened sensitivity to short-term news.
Mark Hackett at Nationwide notes that sentiment and positioning indicators suggest the current rally is underpinned by “cautious optimism rather than speculative excess.” As of September, U.S. retail investors’ average equity allocation stands at 45%, below the 65% seen during the 2000 dot-com peak and the 55% recorded at the 2021 market high. Cash holdings remain at 23%, indicating that the market has not yet developed the broad-based “everyone chasing the rally” characteristics typical of a bubble, providing a potential liquidity buffer for future upside.
Key Focus Ahead
In the short term, the market will need to closely monitor economic data over the coming weeks, particularly employment and inflation indicators, to gauge the Fed’s policy trajectory. Key releases include the August core PCE price index on September 26 and the September nonfarm payrolls on October 6. In the current high-valuation environment, any deviation from expectations could trigger sharp market reactions.
Additionally, the third-quarter earnings season, kicking off in mid-October, will be critical. Guidance from the “Magnificent Seven” tech giants will directly influence investor confidence in high-valuation sectors. Market participants should prepare for potentially heightened volatility.
Disclaimer: The content of this article does not constitute a recommendation or investment advice for any financial products.

Email Subscription
Subscribe to our email service to receive the latest updates
