Gold Breaks Above $3,755, Setting a Historic High
![]() FoolBull
FoolBull
23:59 September 22, 2025 EDT
Key Takeaways
The Fed’s latest rate cut has been the primary driver of gold’s rally. Markets broadly expect this to be only the beginning, with the dot plot pointing to two more cuts this year and continued easing into 2026.
The structural backdrop for gold remains intact. The combination of monetary easing and heightened global uncertainty suggests prices will stay in a medium- to long-term upward trend, albeit with volatility.
As the world enters a new monetary easing cycle and questions about the dollar’s credibility intensify, gold is being redefined as both a traditional safe haven and an inflation hedge in the current market environment.
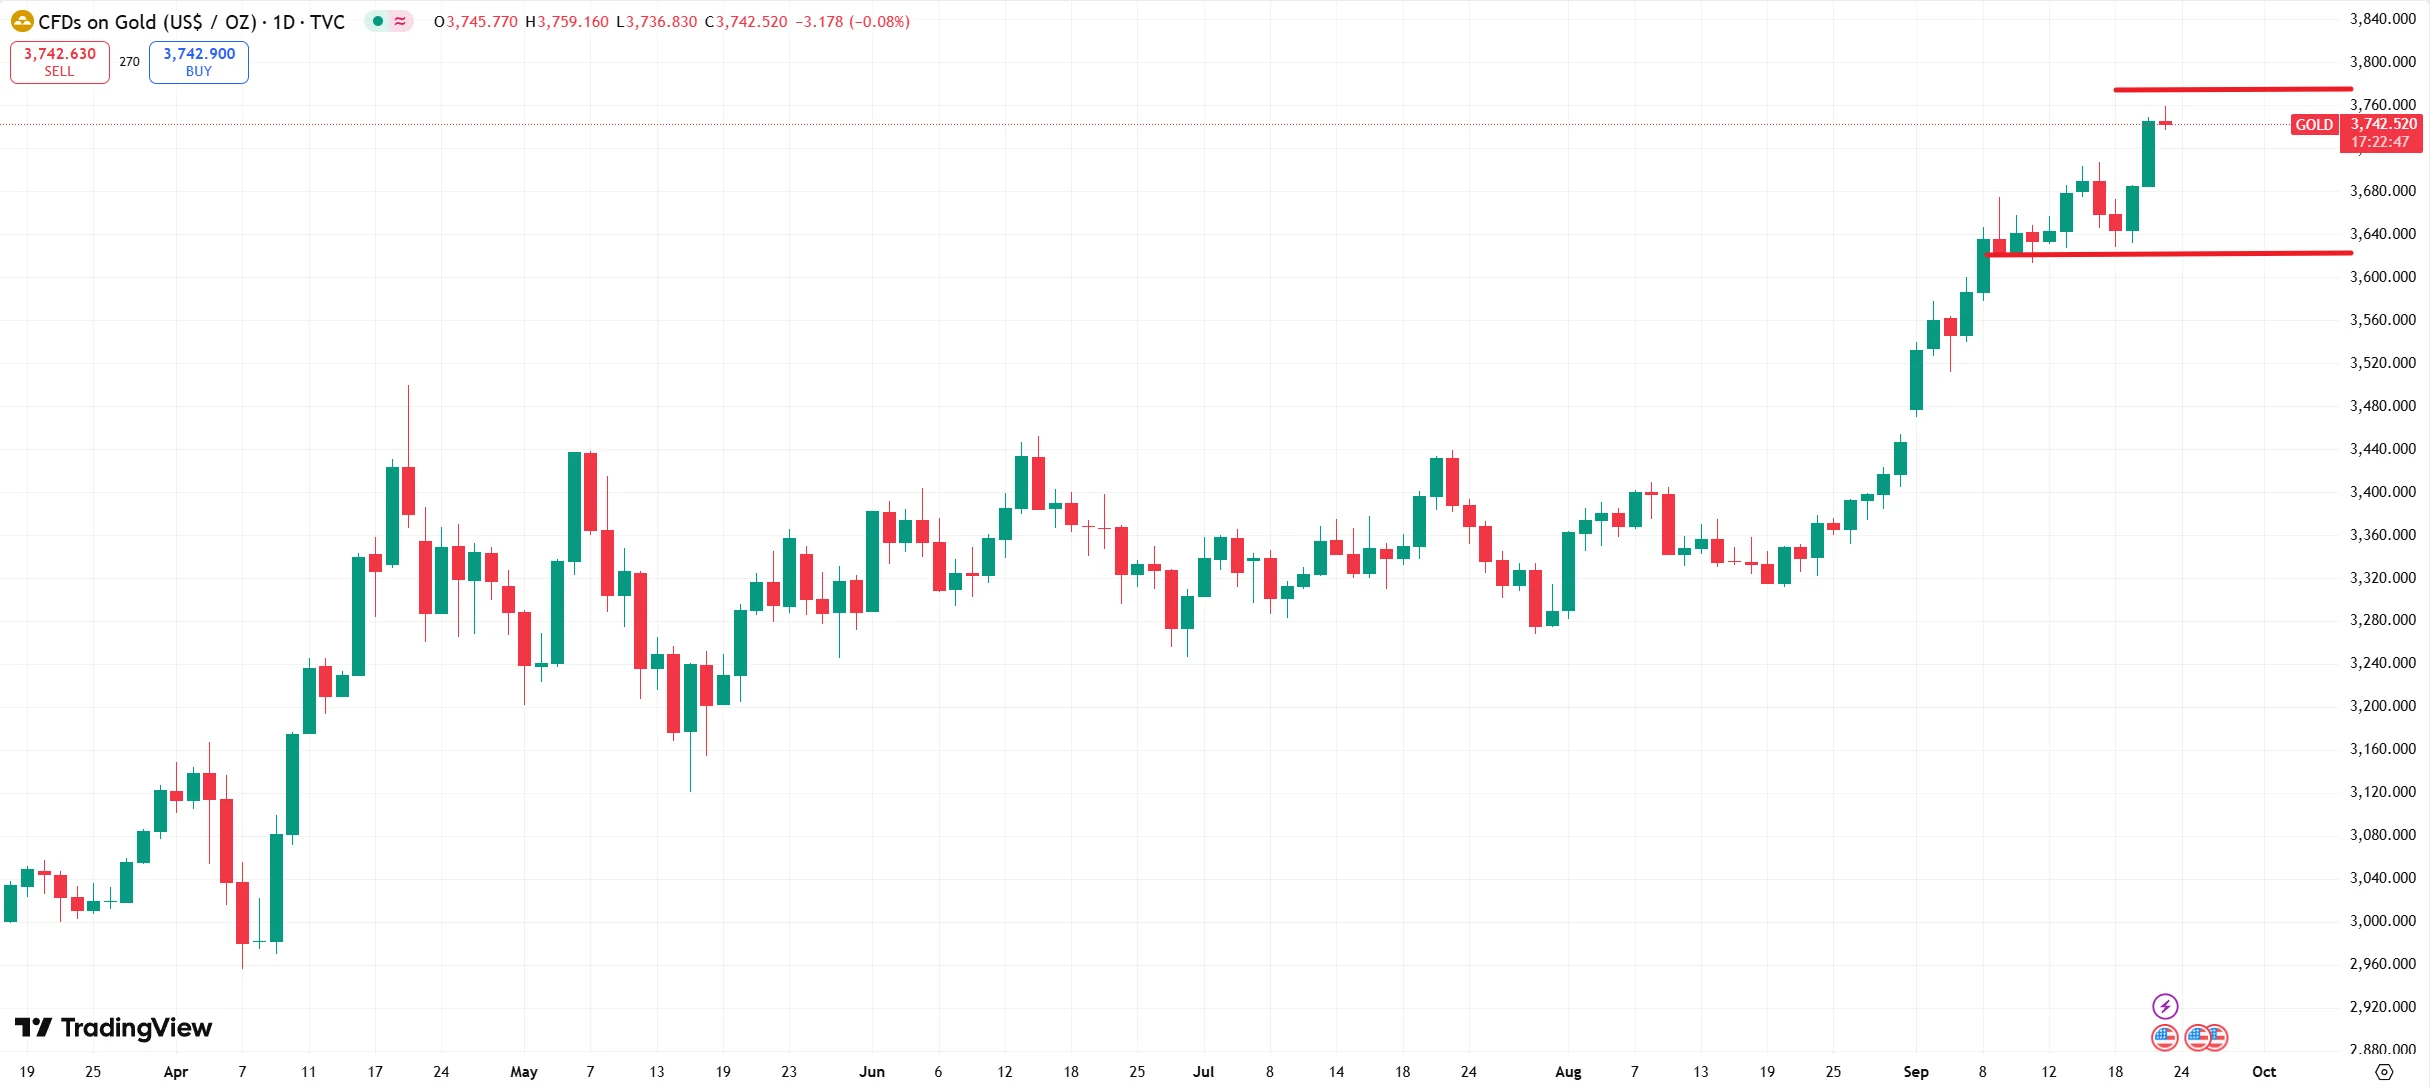
Gold prices have once again set a record. At press time, spot gold is trading above $3,755 an ounce, marking the 36th all-time high so far this year.
Since early September, international gold prices have surged to fresh peaks, breaking through the $3,500, $3,600, and $3,700 levels in quick succession. Compared with the September 1 opening price of $3,447.50, spot gold has already gained nearly 8% month-to-date. Year-to-date, gold is up 42%, on track for its best annual performance since 1979.
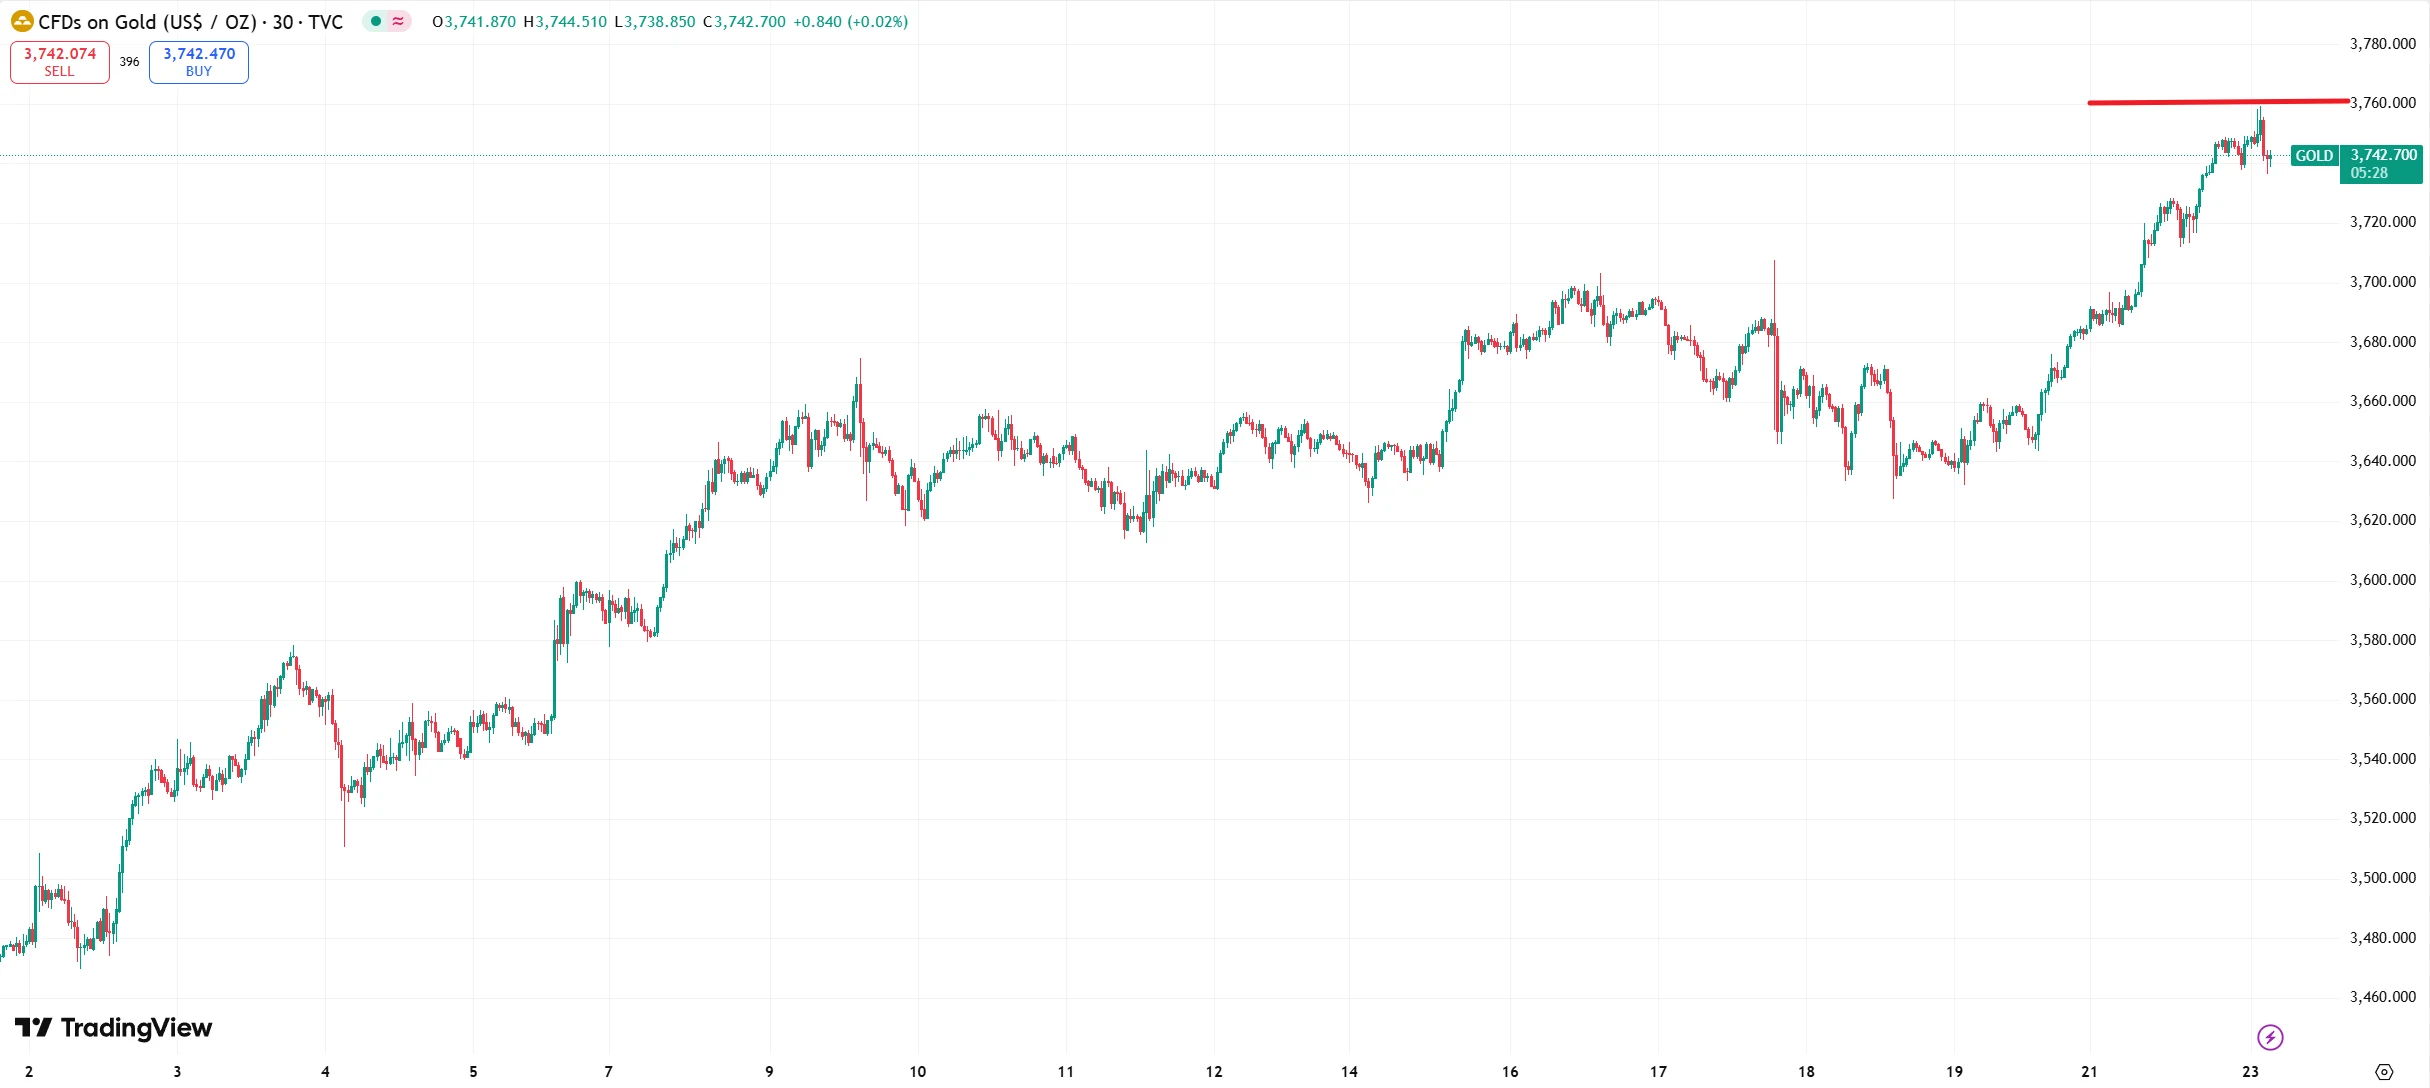
Source: TradingView
The current rally was triggered by the Fed’s latest policy shift. On September 17, the Fed cut the federal funds target range by 25 basis points to 4.00%–4.25%, marking the start of a new easing cycle. Markets view this as only the beginning, with the Fed’s dot plot signaling two more cuts this year and a continuation of accommodative policy through 2026.
Why Is Gold Rising?
The Fed’s policy pivot has been the dominant catalyst. Unlike past easing cycles, this one comes in an unusual context: the economy has not yet entered a recession, while inflation remains sticky. Core PCE inflation is still running at 2.9%, well above the Fed’s 2% target. This means nominal rate cuts translate into a sharp drop in real rates. Lower real yields weaken the relative appeal of U.S. dollar assets, while benefiting gold as a “zero-yielding asset.”
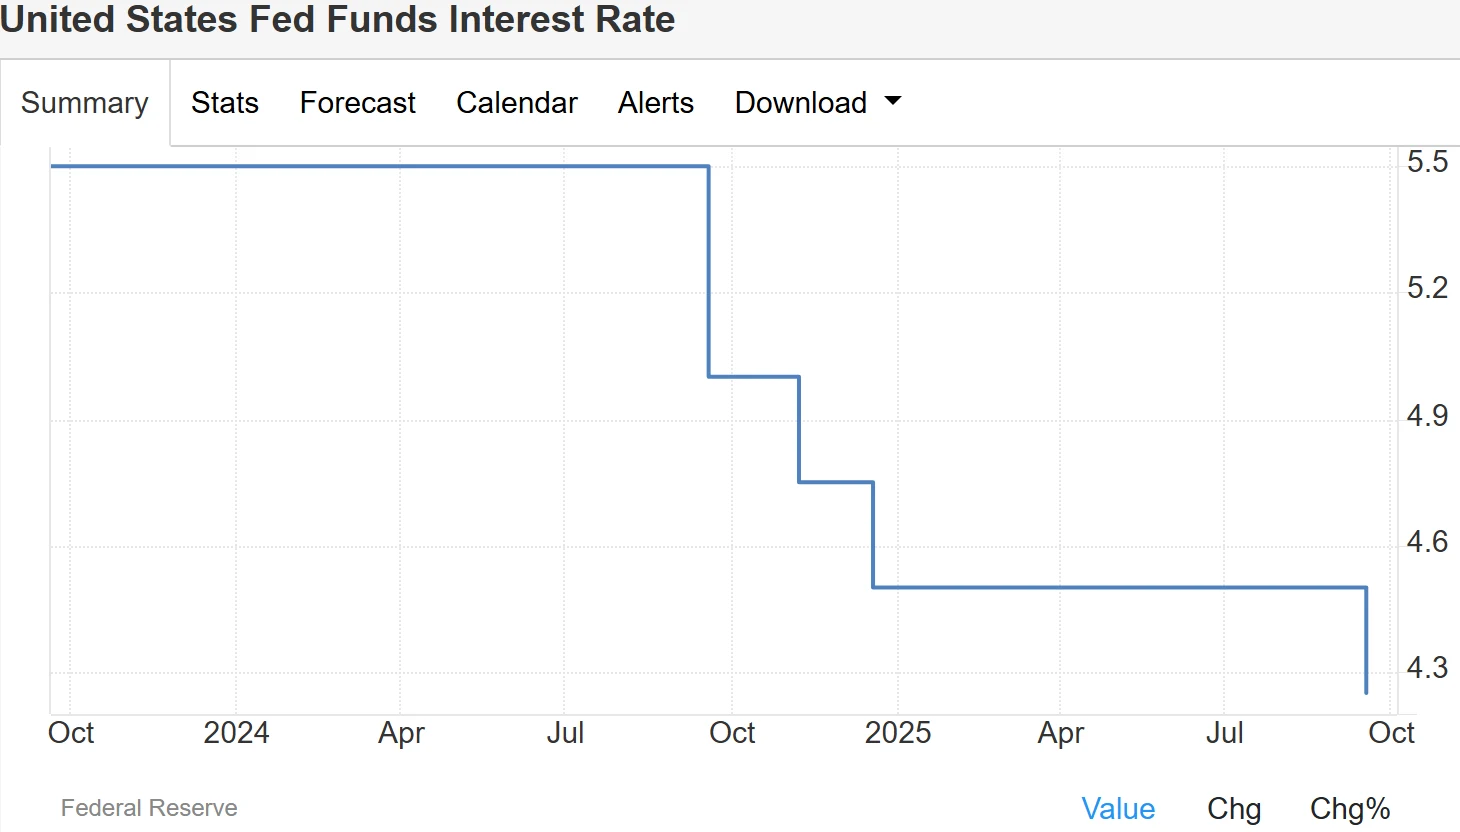
Source: TradingEconomics
According to interest rate parity theory, a one-percentage-point decline in real rates directly reduces the opportunity cost of holding gold, prompting global capital to rotate from dollar assets into precious metals. Meanwhile, the U.S. Dollar Index has dropped more than 10% year-to-date, boosting dollar-denominated gold prices and attracting overseas inflows. The combination of falling yields and a weaker dollar has made gold one of the clearest beneficiaries of the Fed’s pivot.
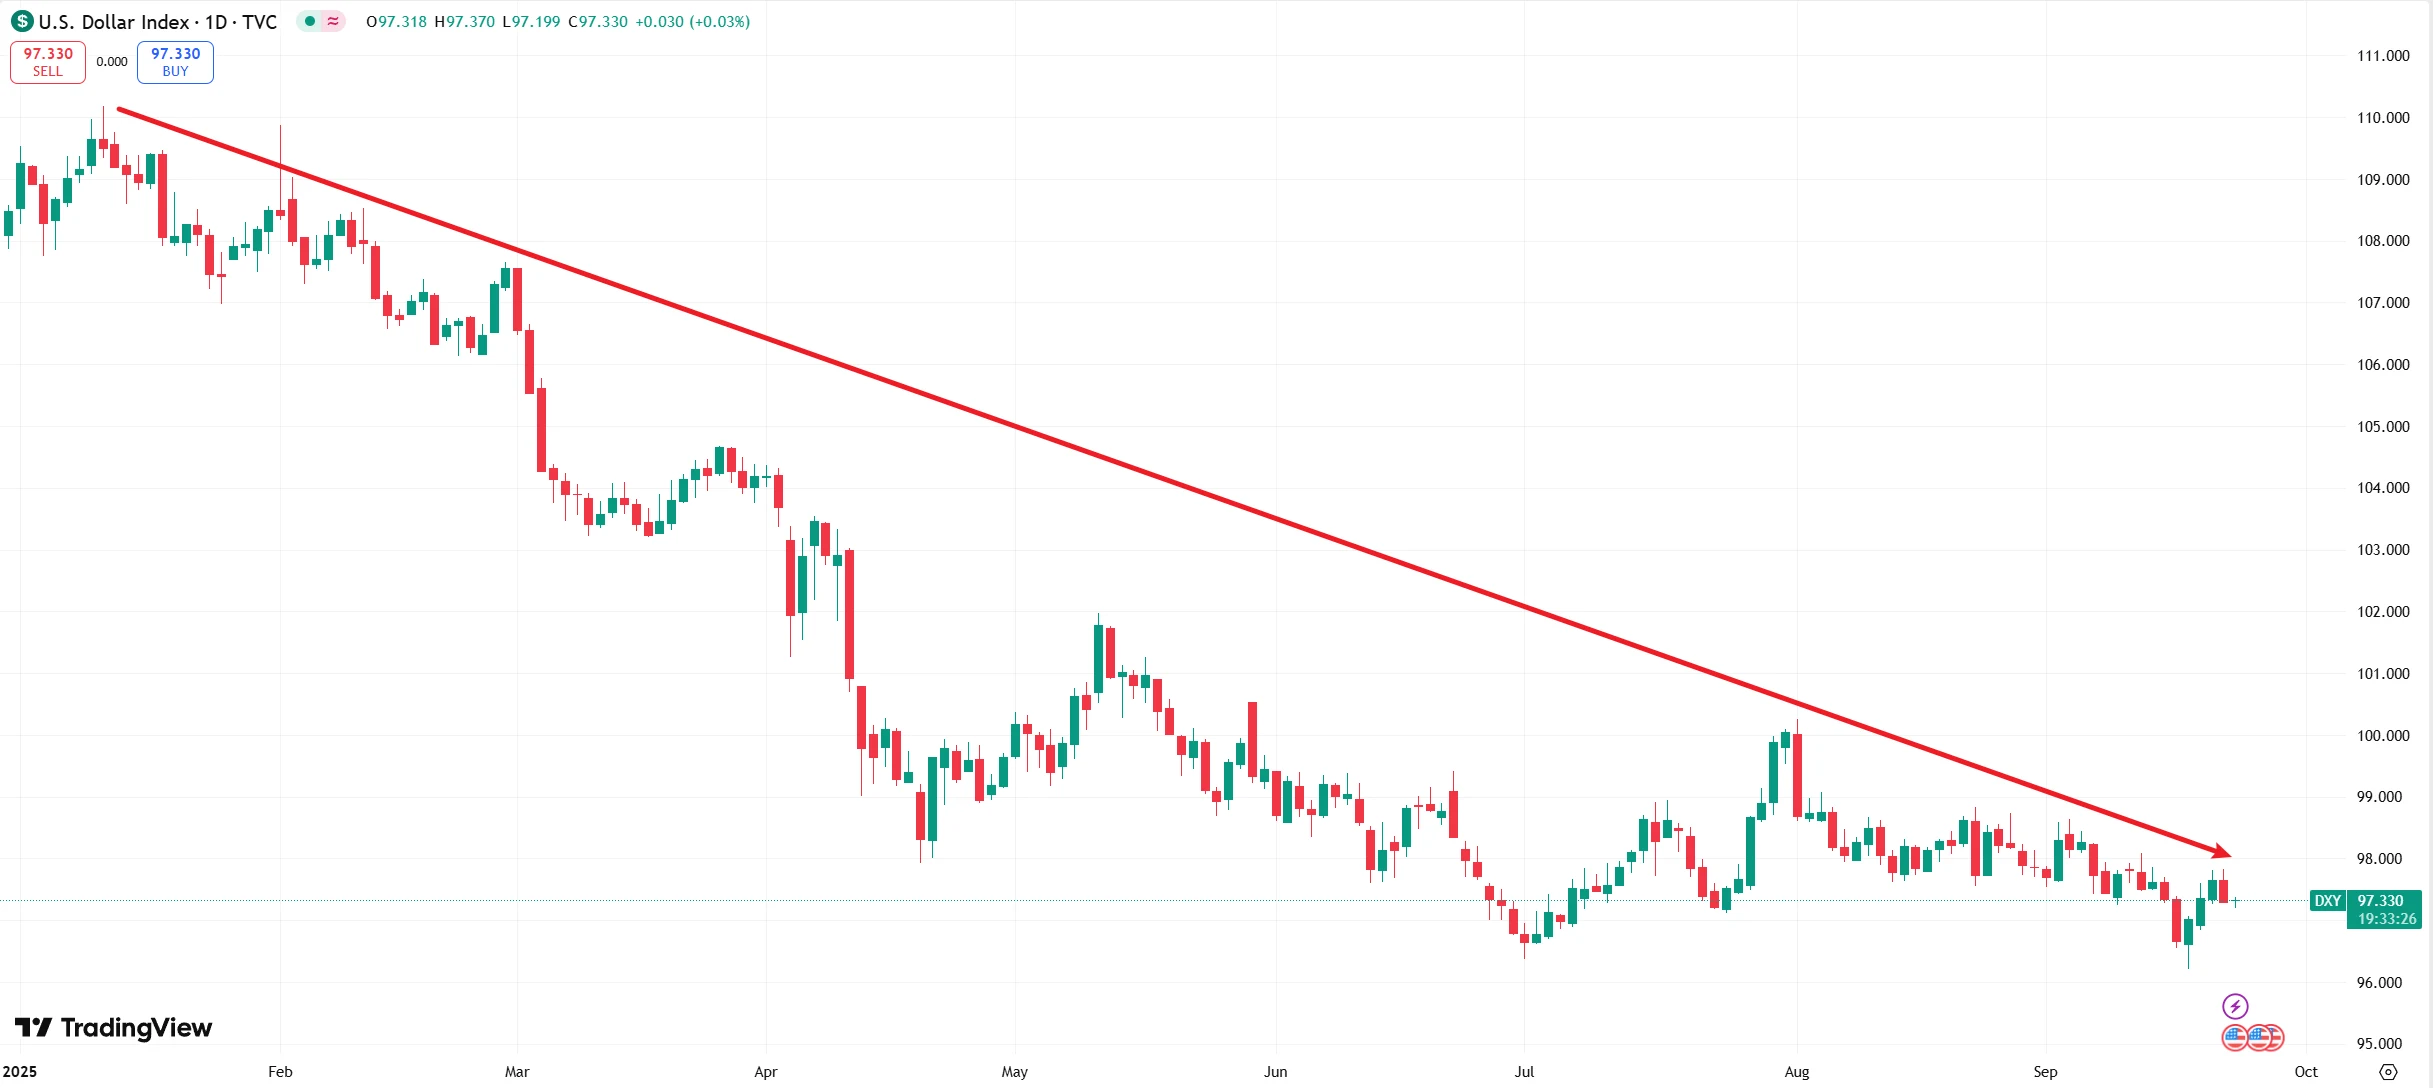
Source: TradingView
Geopolitical tensions have further reinforced gold’s safe-haven bid. The global landscape in 2025 has been defined by “multipolar conflict”: the Israel-Palestine war has dragged on for over 600 days with worsening humanitarian conditions in Gaza; the Russia-Ukraine war has passed 570 days with NATO support escalating, raising spillover risks.
Data from the World Gold Council (WGC) shows ETF inflows surge during spikes in geopolitical risk. On September 20, after Qatar filed a formal complaint against Israel’s strikes, spot gold jumped as much as 1.22% intraday, reflecting urgent safe-haven demand.
At a deeper level, structural shifts in the global monetary system are also driving gold higher. First, the credibility of the dollar is under pressure. U.S. federal debt has surpassed $36 trillion, increasing by $13 trillion since 2020, with an average annual growth of $2.6 trillion. The Congressional Budget Office (CBO) projects a $1.865 trillion budget deficit for fiscal year 2025, equal to 6.2% of GDP.
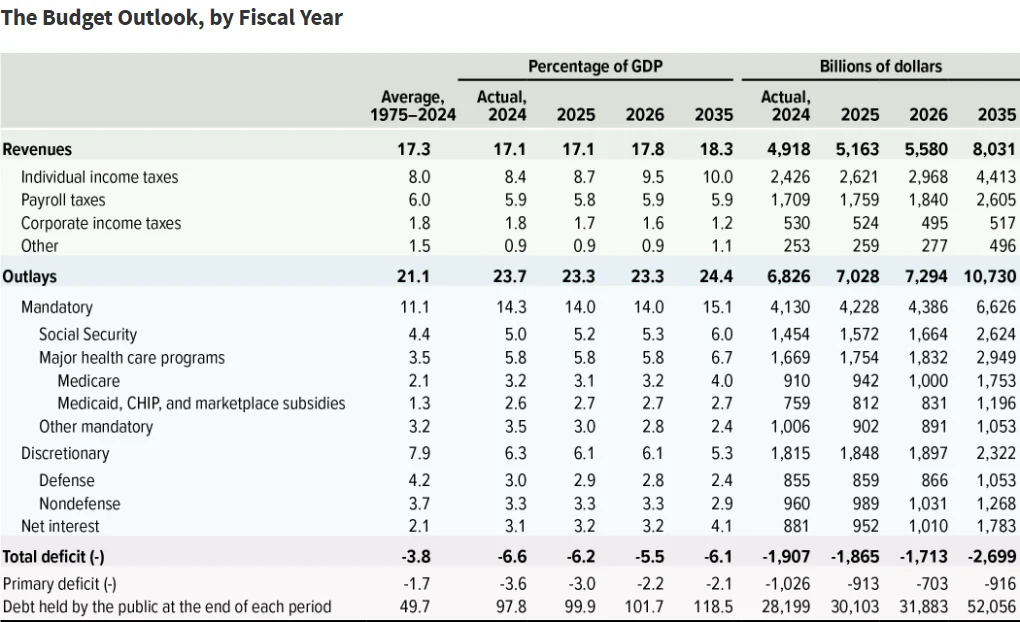
Source: CBO
Meanwhile, the Fed’s balance sheet stands at $6.64 trillion, down about 25% from its 2022 peak of $8.92 trillion. During 2020–21, it nearly doubled from $4 trillion to almost $9 trillion, fueling long-term inflation concerns.
Equally important, the “weaponization” of the dollar—such as freezing Russia’s central bank reserves—has eroded its status as a neutral reserve currency. In the WGC’s 2025 central bank survey, 95% of respondents expect global gold reserves to keep rising, while 43% plan to increase holdings within 12 months, up 17 percentage points from 2024. This official sector buying provides durable support. In Q2 2025, global gold demand rose 3% year-on-year to 1,249 tons, while in value terms it surged 45% to a record $132 billion.
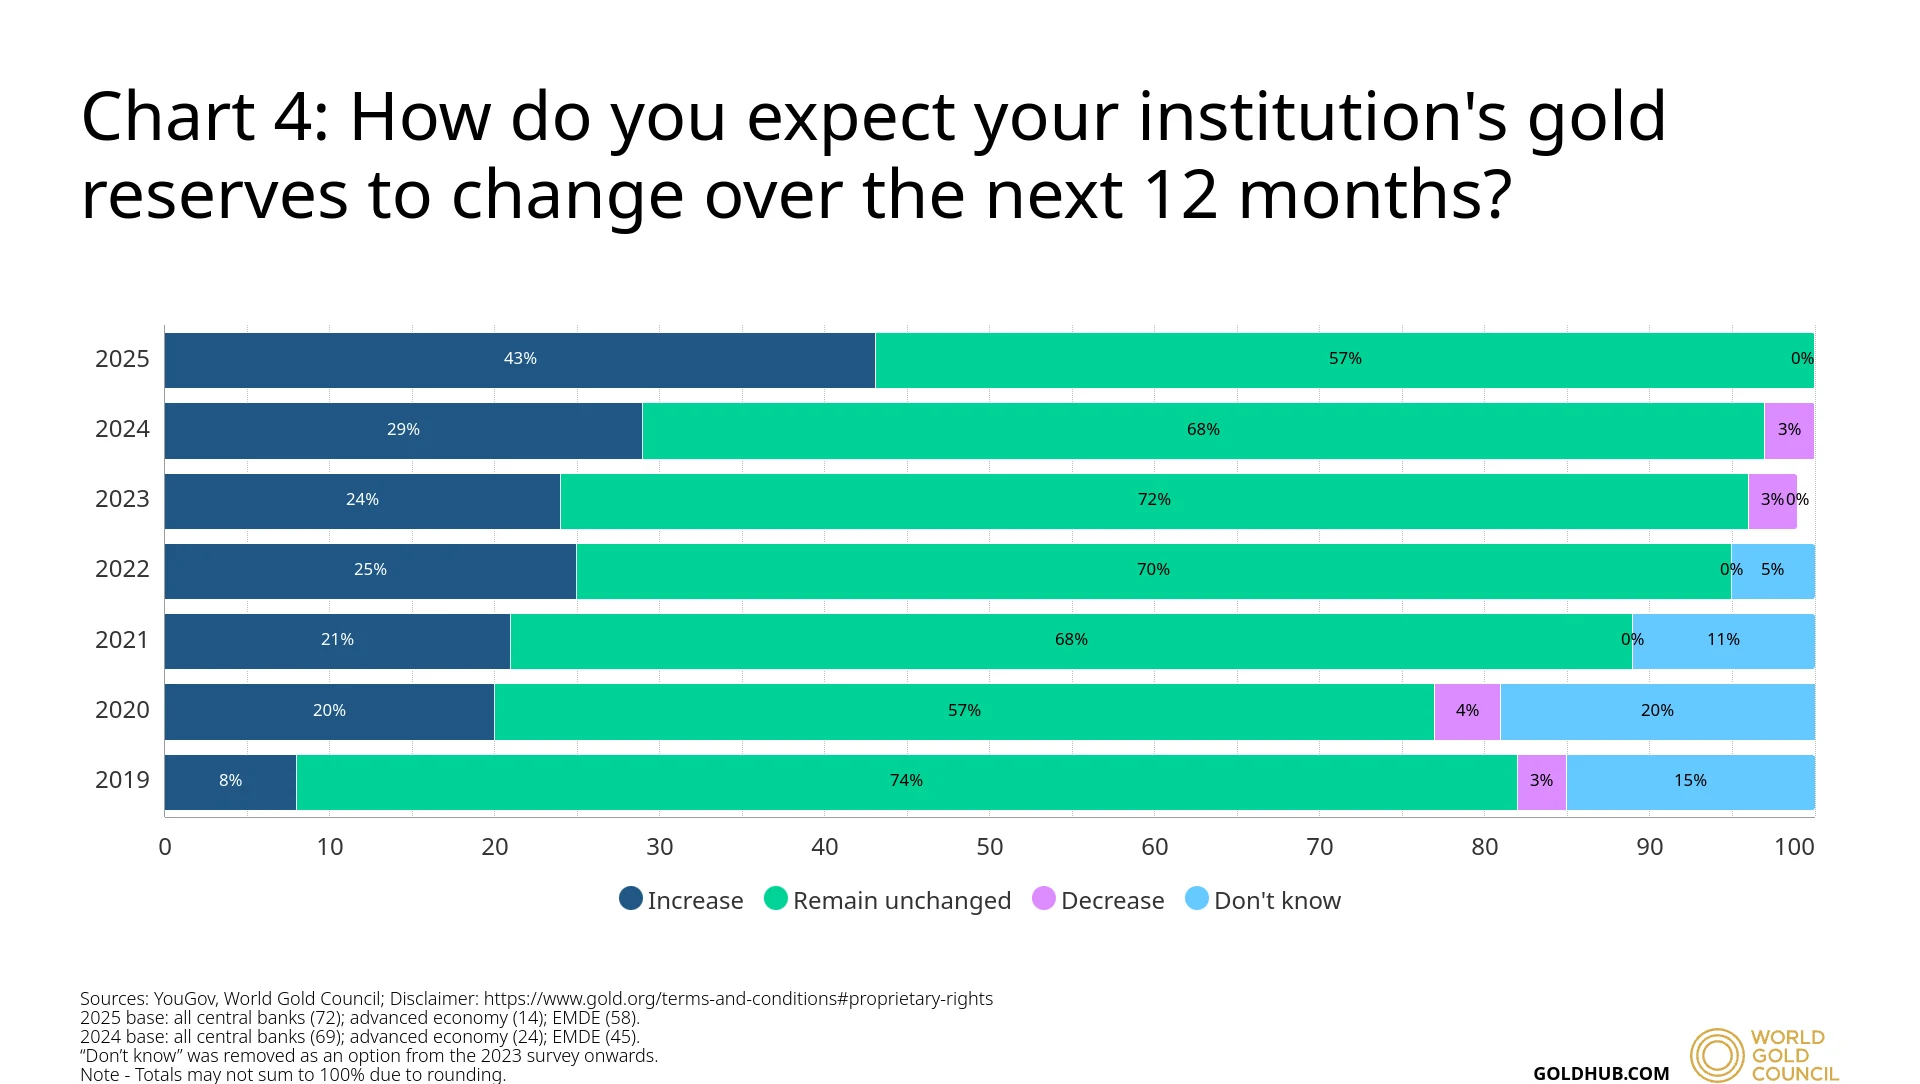
Source: World Gold Council
Shifts in market participation are amplifying gains. Younger investors, increasingly active via digital gold savings plans and ETFs, tend to prefer strategic allocations over short-term trading. In H1 2025, global gold ETFs attracted $38 billion in inflows, equivalent to 397.1 tons, lifting total holdings to 3,615.9 tons—the highest since August 2022.
On the technical front, momentum has been strong since September. After breaking above $3,500 on September 2 and $3,600 on September 6, gold surged past $3,700 in just nine days. The breakout above $3,600 triggered algorithmic buying, accelerating the rally. From September 6 to 19, spot prices climbed 2.35% from around $3,600 to $3,684.65.
This momentum has pushed the RSI to 78, deep in overbought territory and the highest in nearly a decade, signaling strong bullish sentiment and elevated investor enthusiasm.
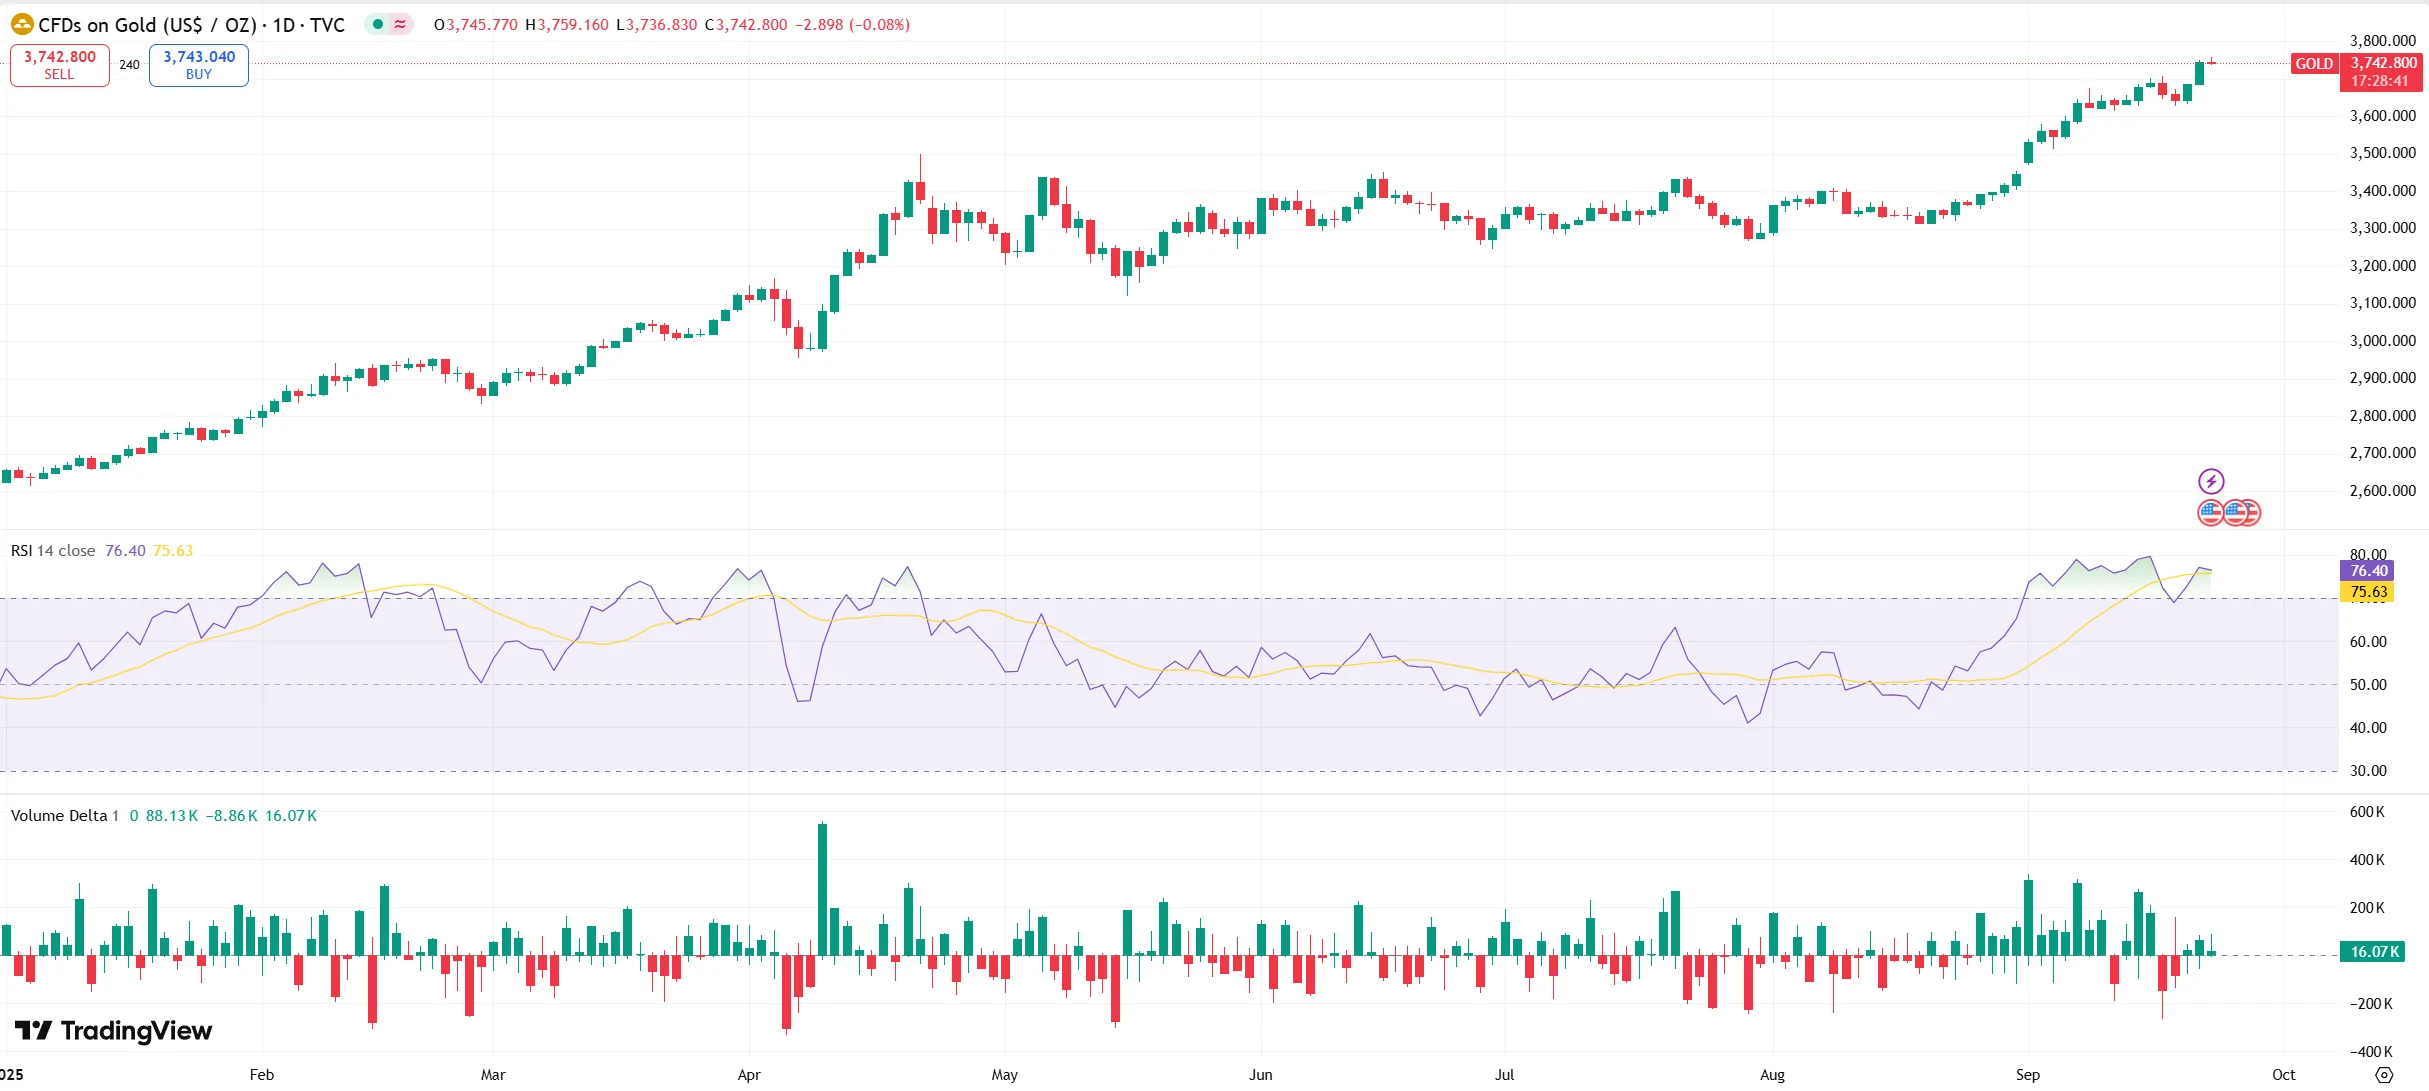
Source: TradingView
Gold’s Historical Cycles
Gold’s price history can be divided into distinct phases, each shaped by macroeconomic conditions and policy regimes.
Fixed-Price Era (1920s–1971): Under the gold standard, prices were fixed at $20.67/oz in the 1920s. In 1933, the U.S. raised the official price to $35 to combat the Great Depression. The 1944 Bretton Woods system pegged the dollar to gold and other currencies to the dollar, locking gold at $35/oz for 27 years until the system collapsed in 1971. President Nixon then ended dollar convertibility, ushering in free-floating gold.
First Bull Market (1971–1980): Following Bretton Woods’ collapse, gold soared from $35 to $850/oz, driven by two oil shocks, surging U.S. CPI inflation (peaking at 13.5%), persistently negative real rates, and geopolitical crises such as the Soviet invasion of Afghanistan. This period cemented gold’s role as a hedge against monetary debasement.
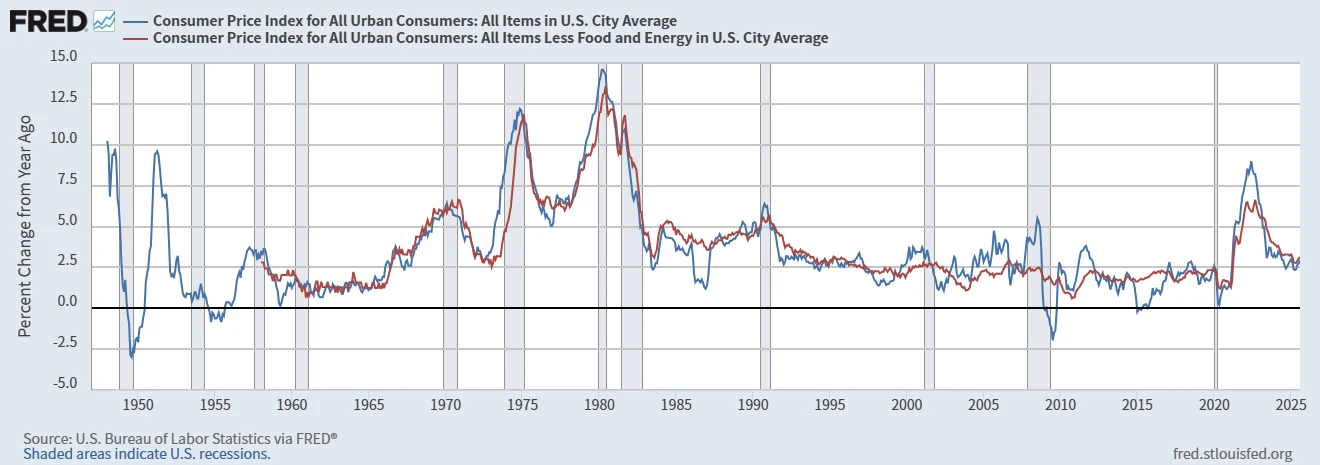
Source: FRED
Prolonged Bear Market (1980–2001): Fed Chair Paul Volcker’s aggressive tightening pushed rates to 20%, driving real yields sharply higher and gold into a two-decade decline. Prices fell 70% to $251/oz as low-inflation growth and a strong dollar reduced gold’s appeal.
Second Bull Market (2001–2011): Fed easing after the dot-com bust and the 2008 financial crisis drove the dollar index from 120 (2002) to 73 (2011). Gold rallied 647% from $257 to $1,920/oz, becoming a hedge against systemic financial risk. Central banks shifted from net sellers to net buyers.
Correction Phase (2012–2015): With U.S. recovery underway, the Fed signaled tapering in 2013 and began rate hikes in 2015. The dollar index rose from 80 to 103, while gold nearly halved from $1,900 to $1,046.
Current Bull Market (2016–2025): Multiple drivers converged: the pandemic’s global monetary stimulus, escalating geopolitical tensions, the Fed’s 2024 easing cycle, and record central bank demand. Prices climbed from $1,060 in 2016 to $3,755 in September 2025—a nine-year gain of 254%. Notably, central bank purchases now account for 13.3% of total demand, up 8 points from 2010, underscoring gold’s role in sovereign asset allocation.
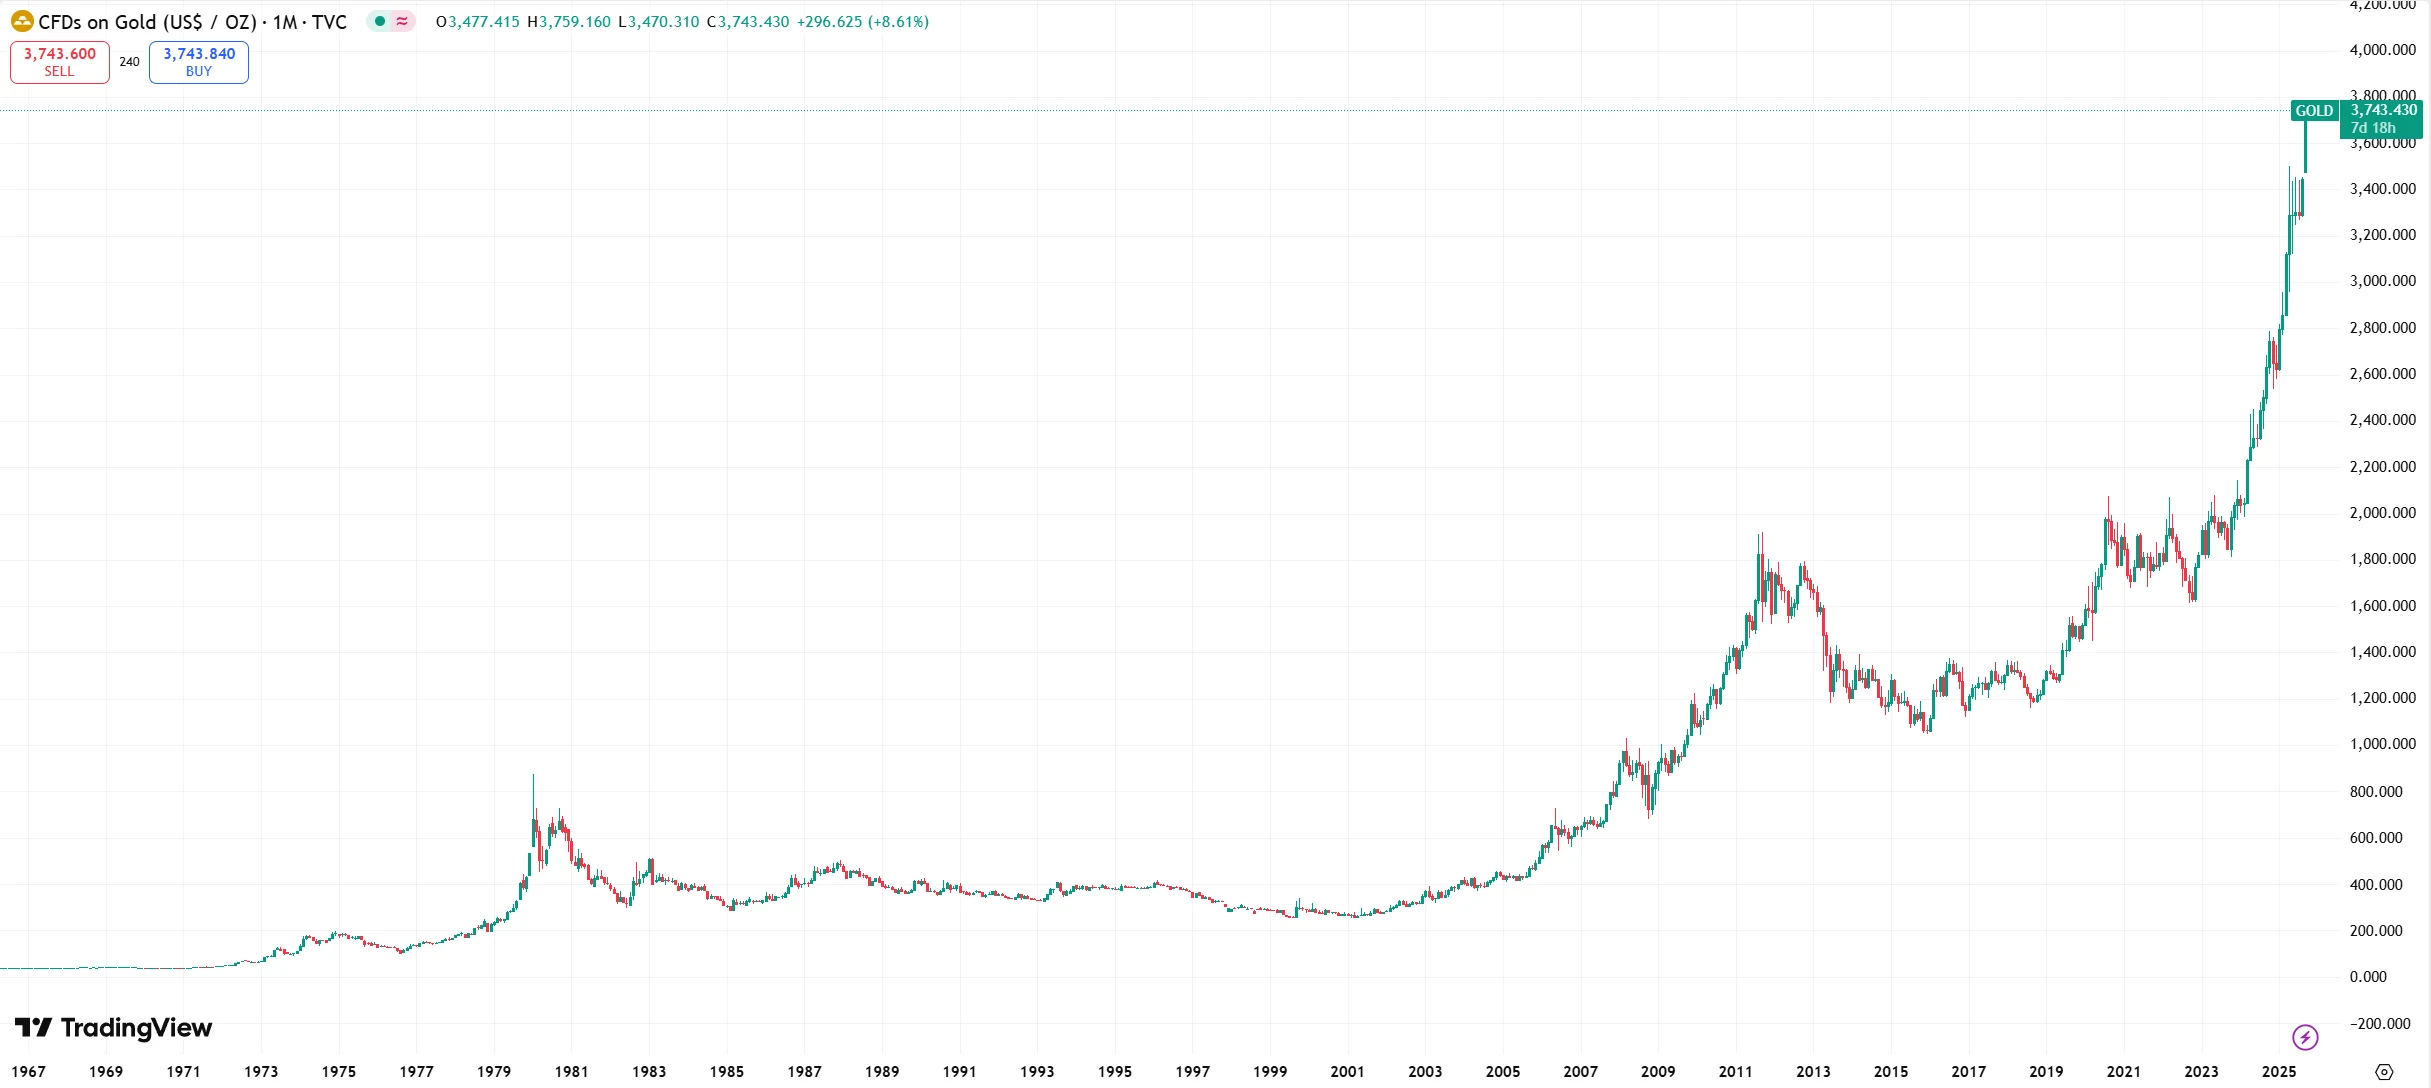
Source: TradingView
The Next Threshold
The Fed projects another 50 bps in cuts by end-2025, followed by 25 bps per year in 2026 and 2027. This path signals continued downward pressure on real yields, laying the foundation for further gold gains.
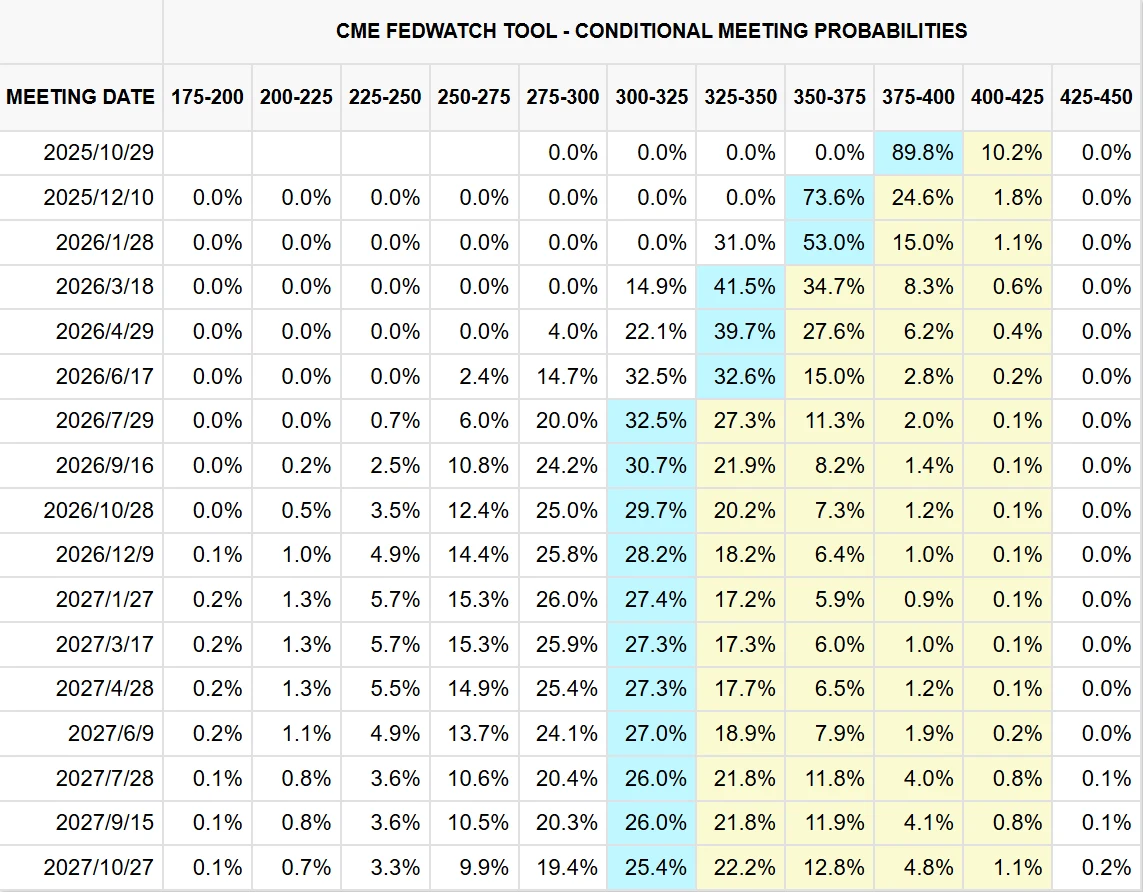
Source: CME Group
Wall Street banks remain bullish. Goldman Sachs sees gold at $4,000/oz by mid-2026. JPMorgan expects spot prices to cross that threshold in early 2026. UBS has lifted its year-end 2025 target to $3,800. While timelines differ, consensus is clear: falling real yields and persistent safe-haven demand will drive fresh highs.
The logic is straightforward: sticky inflation and slowing growth make real rate compression hard to reverse; geopolitical risks from the Middle East to Ukraine remain unresolved; and central bank demand is poised to hit a record. The WGC forecasts official sector purchases will exceed 1,000 tons in 2025.
Technically, resistance lies between $3,714 and $3,766. Failure to break above $3,766 could trigger a pullback, while support around $3,632–$3,663 should provide a platform for renewed gains if it holds.
Source: TradingView
Risks remain. With rate cuts largely priced in, heavy speculative long positions could unwind, sparking corrections. Critics argue gold lacks intrinsic cash flow fundamentals, making it prone to volatility.
However, options market signals suggest this is an “active and sustained bull market” rather than a bubble. Implied volatility is within normal ranges, and demand for deep out-of-the-money calls has not spiked irrationally—evidence that investor sentiment is bullish but not euphoric.
As the global easing cycle takes hold and the dollar’s role evolves, gold is being redefined—not just as a hedge, but as a strategic cornerstone of the new financial order.
Disclaimer: The content of this article does not constitute a recommendation or investment advice for any financial products.

Email Subscription
Subscribe to our email service to receive the latest updates
